








NZ job ads by region give you a starting point for a focused search. MBIE’s September 2026 release reports annual advertising growth in eight of ten regional groups, even as national growth slowed. The useful next question is whether a region also has work that fits your occupation, eligibility and practical circumstances.
Our analysis uses MBIE’s full current quarterly CSV, not an older file with one new row added. Five charts separate the national headline, category breadth, regional growth, industries and occupations. An evidence-funnel infographic and four free CSV downloads help you turn those signals into a research shortlist. They do not identify jobs hiring now.
What changed in the September advertising release
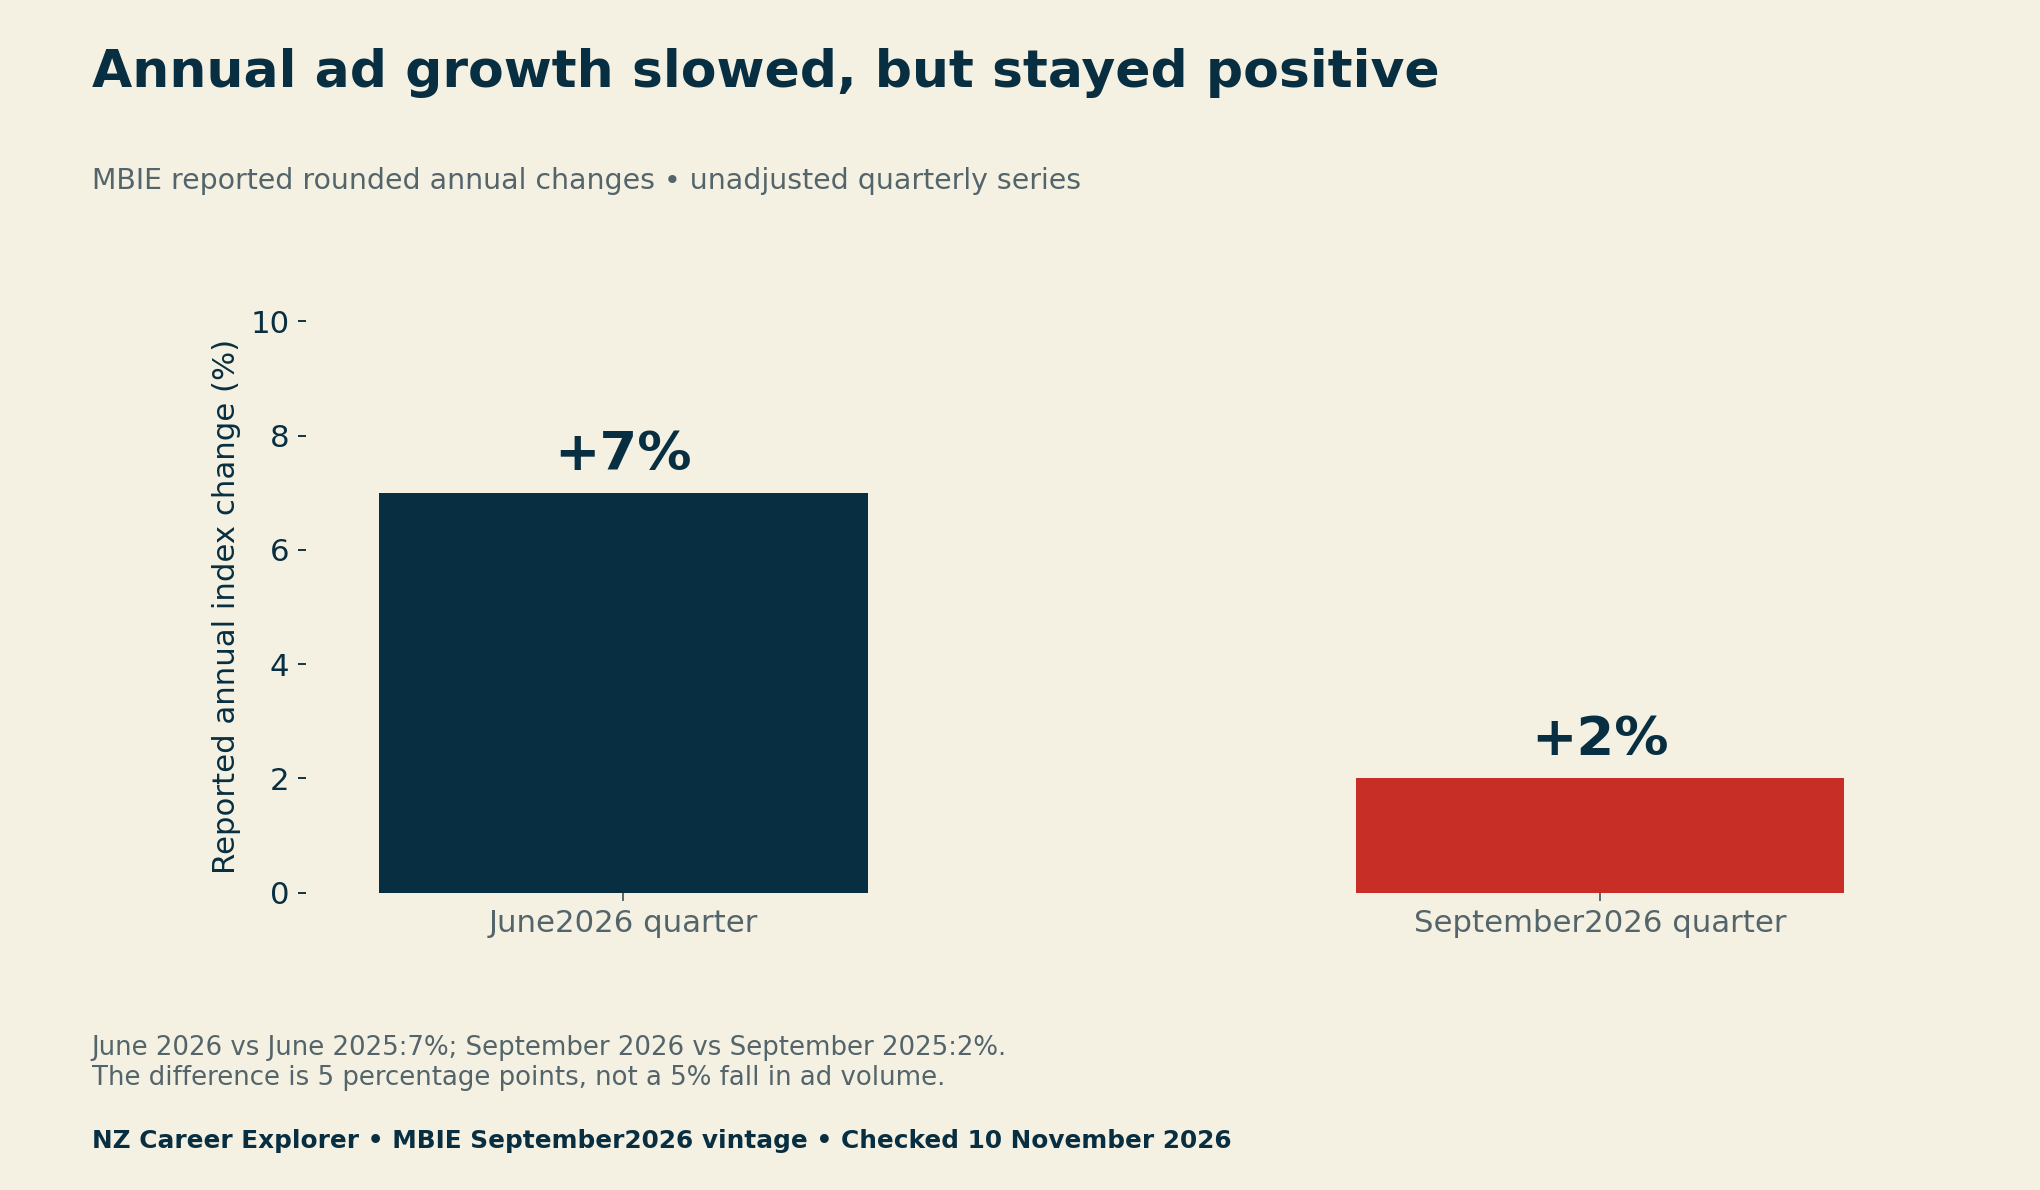
The MBIE Jobs Online page reports 2% annual growth for the September 2026 quarter, after 7% for June. Both compare a quarter with the same quarter one year earlier. The change between those rounded growth rates is 5 percentage points. It is not a 5% fall in the number of advertisements.
MBIE’s document-library entry labels the September report “Published: 6 Nov 2026.” That is the actual publication label we checked. Its older release calendar planned 30 October, which is not proof that the report appeared then. September is the observation quarter; November is the release month.
The downloaded indices give national growth of about 1.81%, using 163.2÷160.3−1. That is consistent with the overview’s whole-number 2% after rounding. We do not imply that calculations from indices displayed to one decimal reproduce every unrounded internal source value exactly. The data file preserves the inputs and formulas.
Eight growing regional groups is a breadth measure
The overview’s fractions describe different sets of categories: 5 of 9 industries,6 of 8 occupations and8 of 10 regional groups grew annually. These become 55.6%,75.0% and80.0%. Each category has equal weight within its own calculation. A small category counts once, just as a large category does.
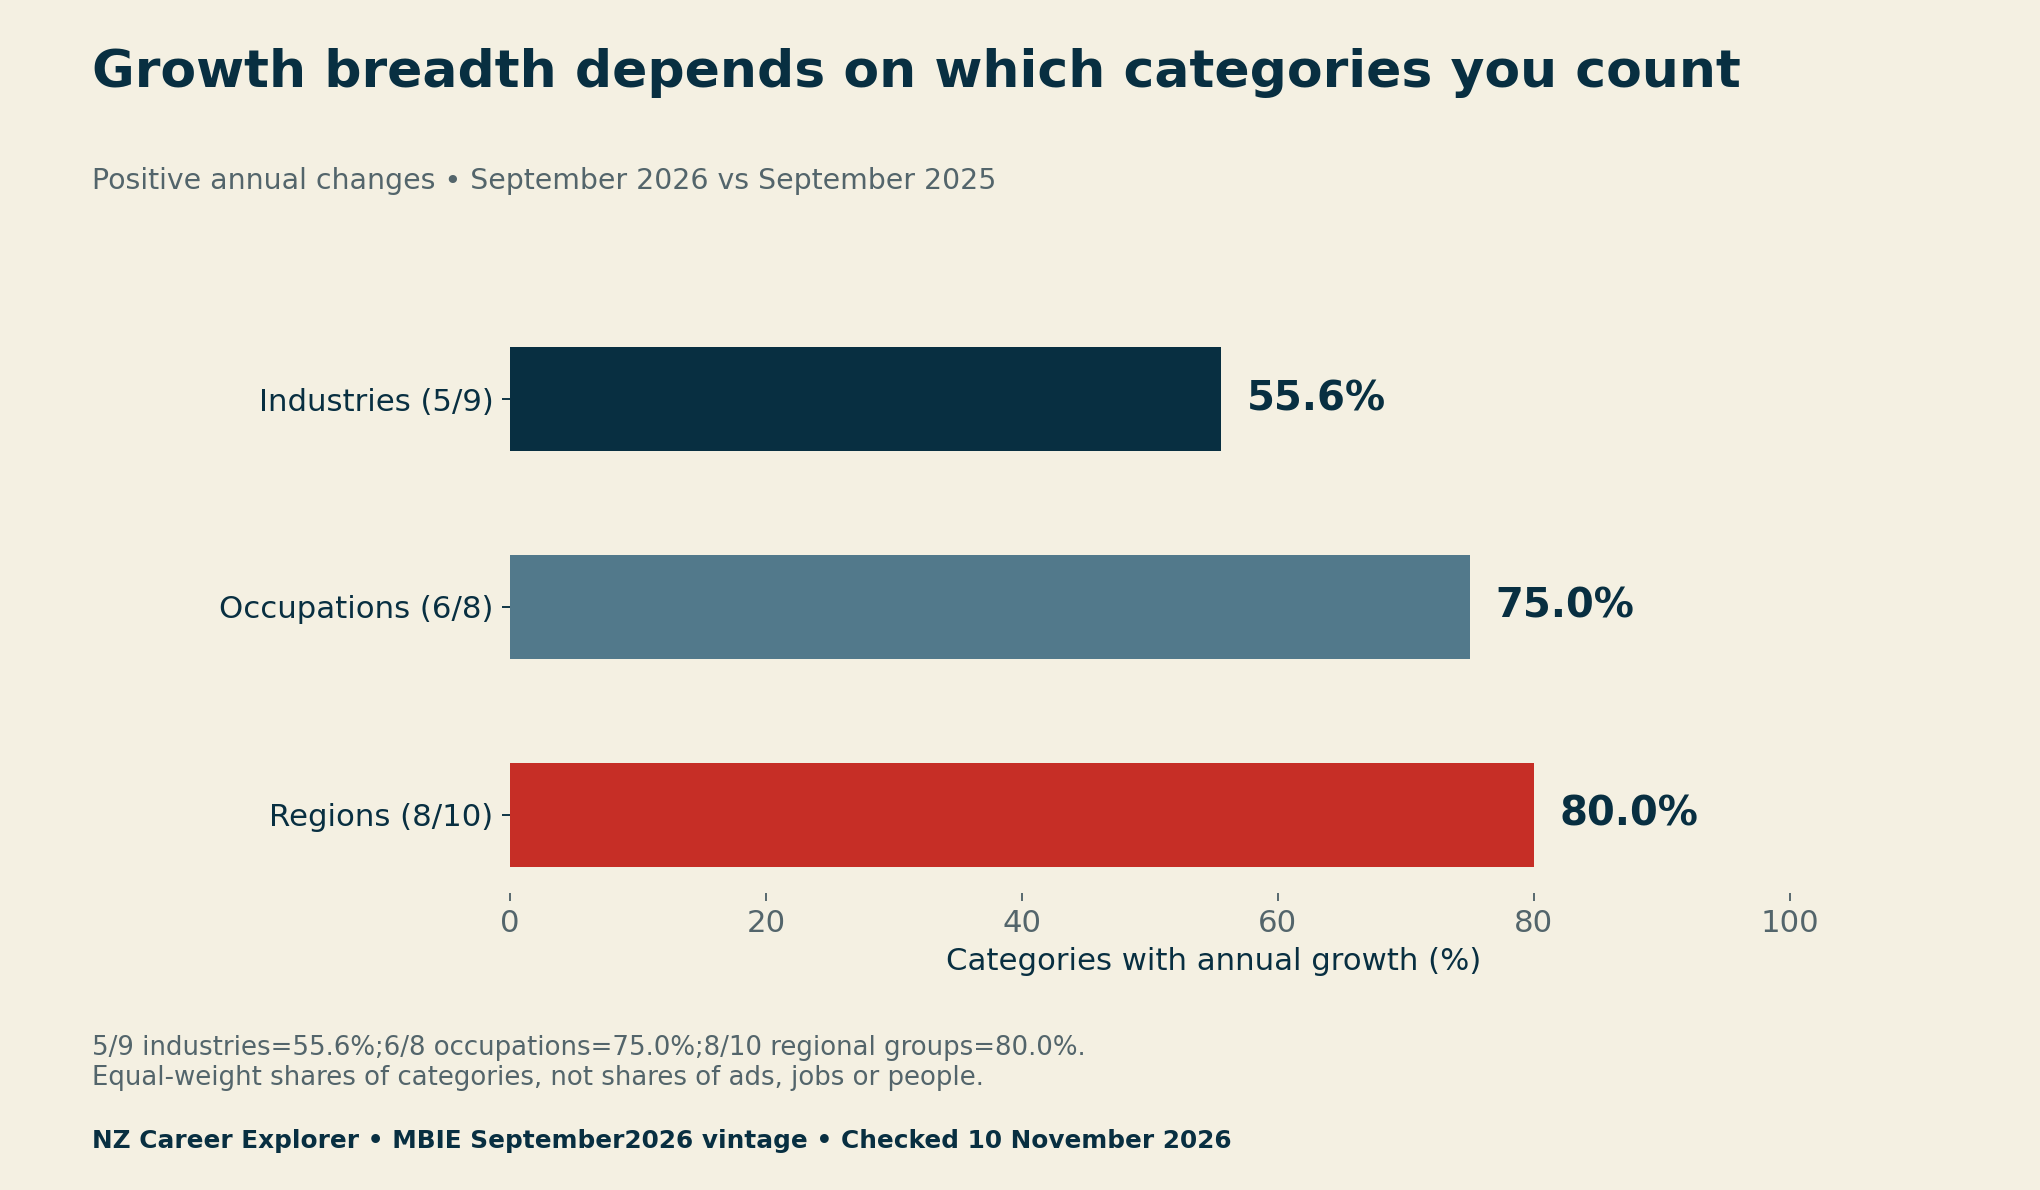
Keep those denominators beside a reused statistic. The ten MBIE regional groups are not the sixteen regional-council areas used in some other datasets. Several names combine places. Do not split a grouped percentage into separate local estimates or compare it directly with a differently defined map.
Compare NZ job ads by region using the current vintage
We filtered the consolidated file to KEYA=Totals and the ten named regional series in KEYBB. For each, we matched September 2025 with September 2026 and calculated 100×(current÷prior−1). This selects each region’s overall index rather than accidentally mixing its industry breakdowns into the regional total.
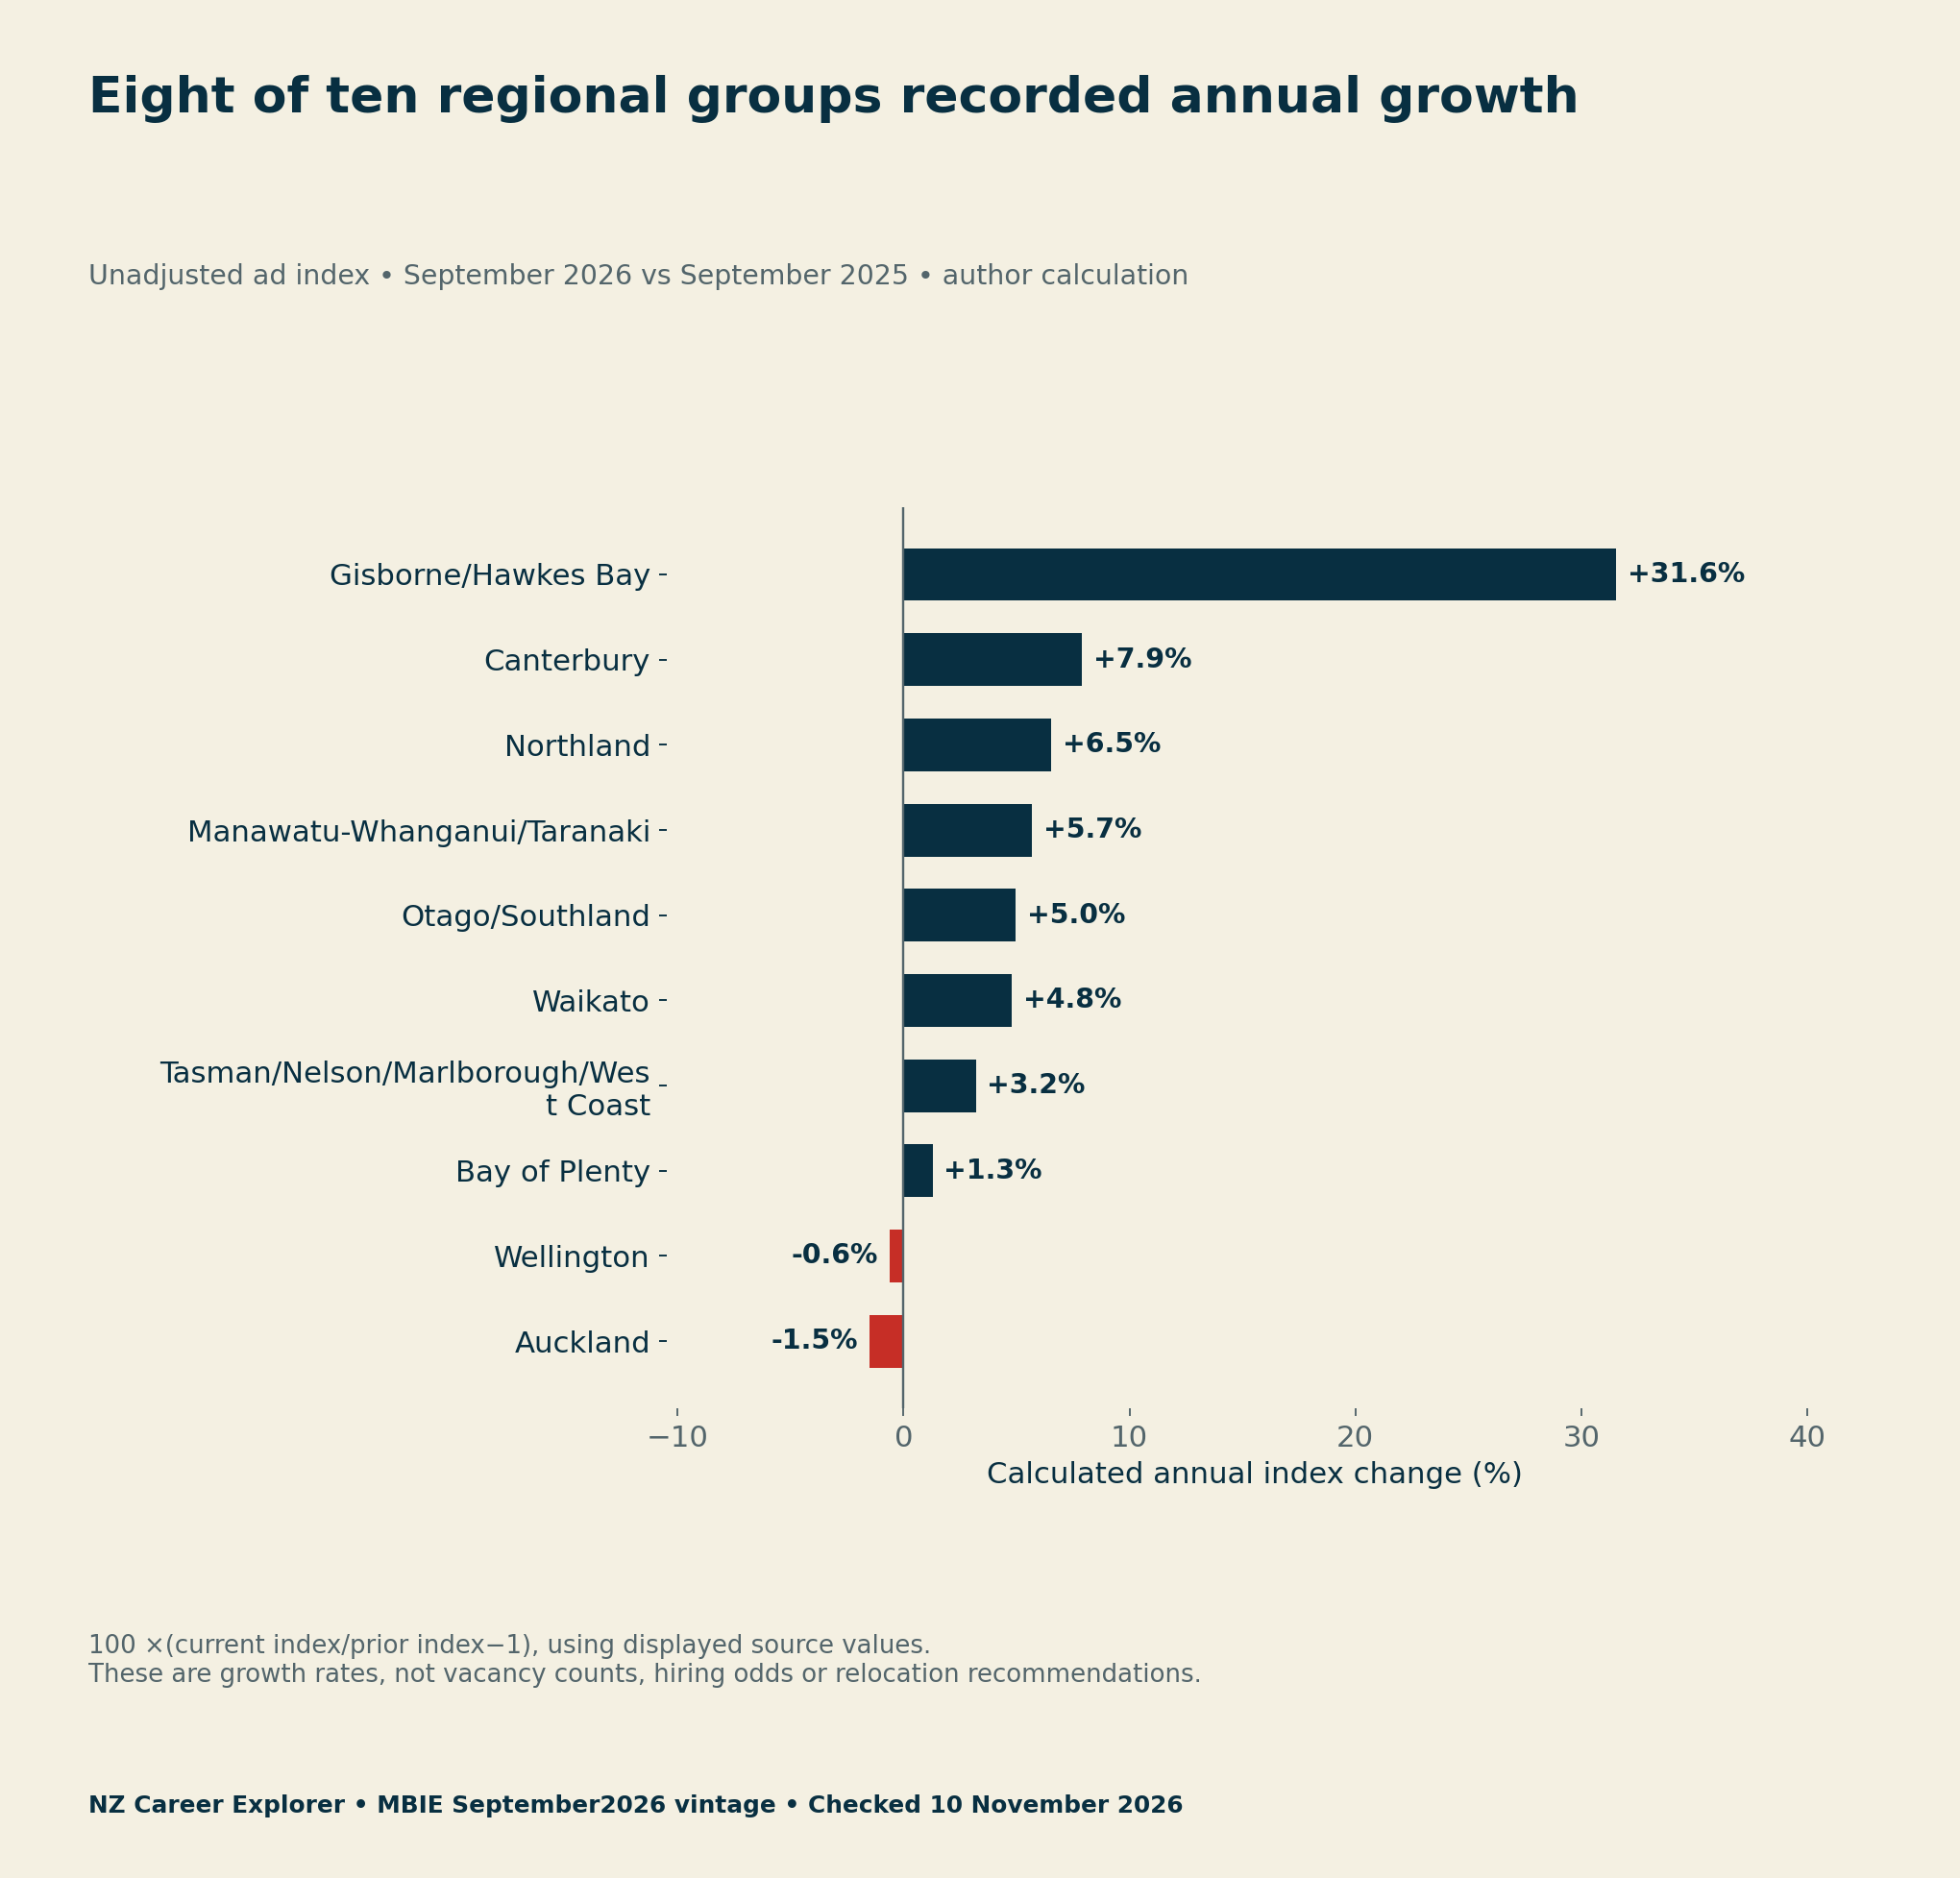
Gisborne/Hawkes Bay has the largest calculated annual increase, 31.6%. That does not establish the largest number of vacancies or the best personal move. Growth rates depend on starting levels. Advertising can also reflect turnover or recruitment channels. A high percentage should prompt a closer employer check rather than an automatic relocation decision.
Auckland’s calculated −1.5% and Wellington’s −0.6% do not mean that no suitable roles exist there. A regional total can hide differences among occupations and industries. Similarly, a growing group can include employers that are not recruiting. Match the relevant work before comparing the costs of changing location.
Add industry and occupation to the regional signal
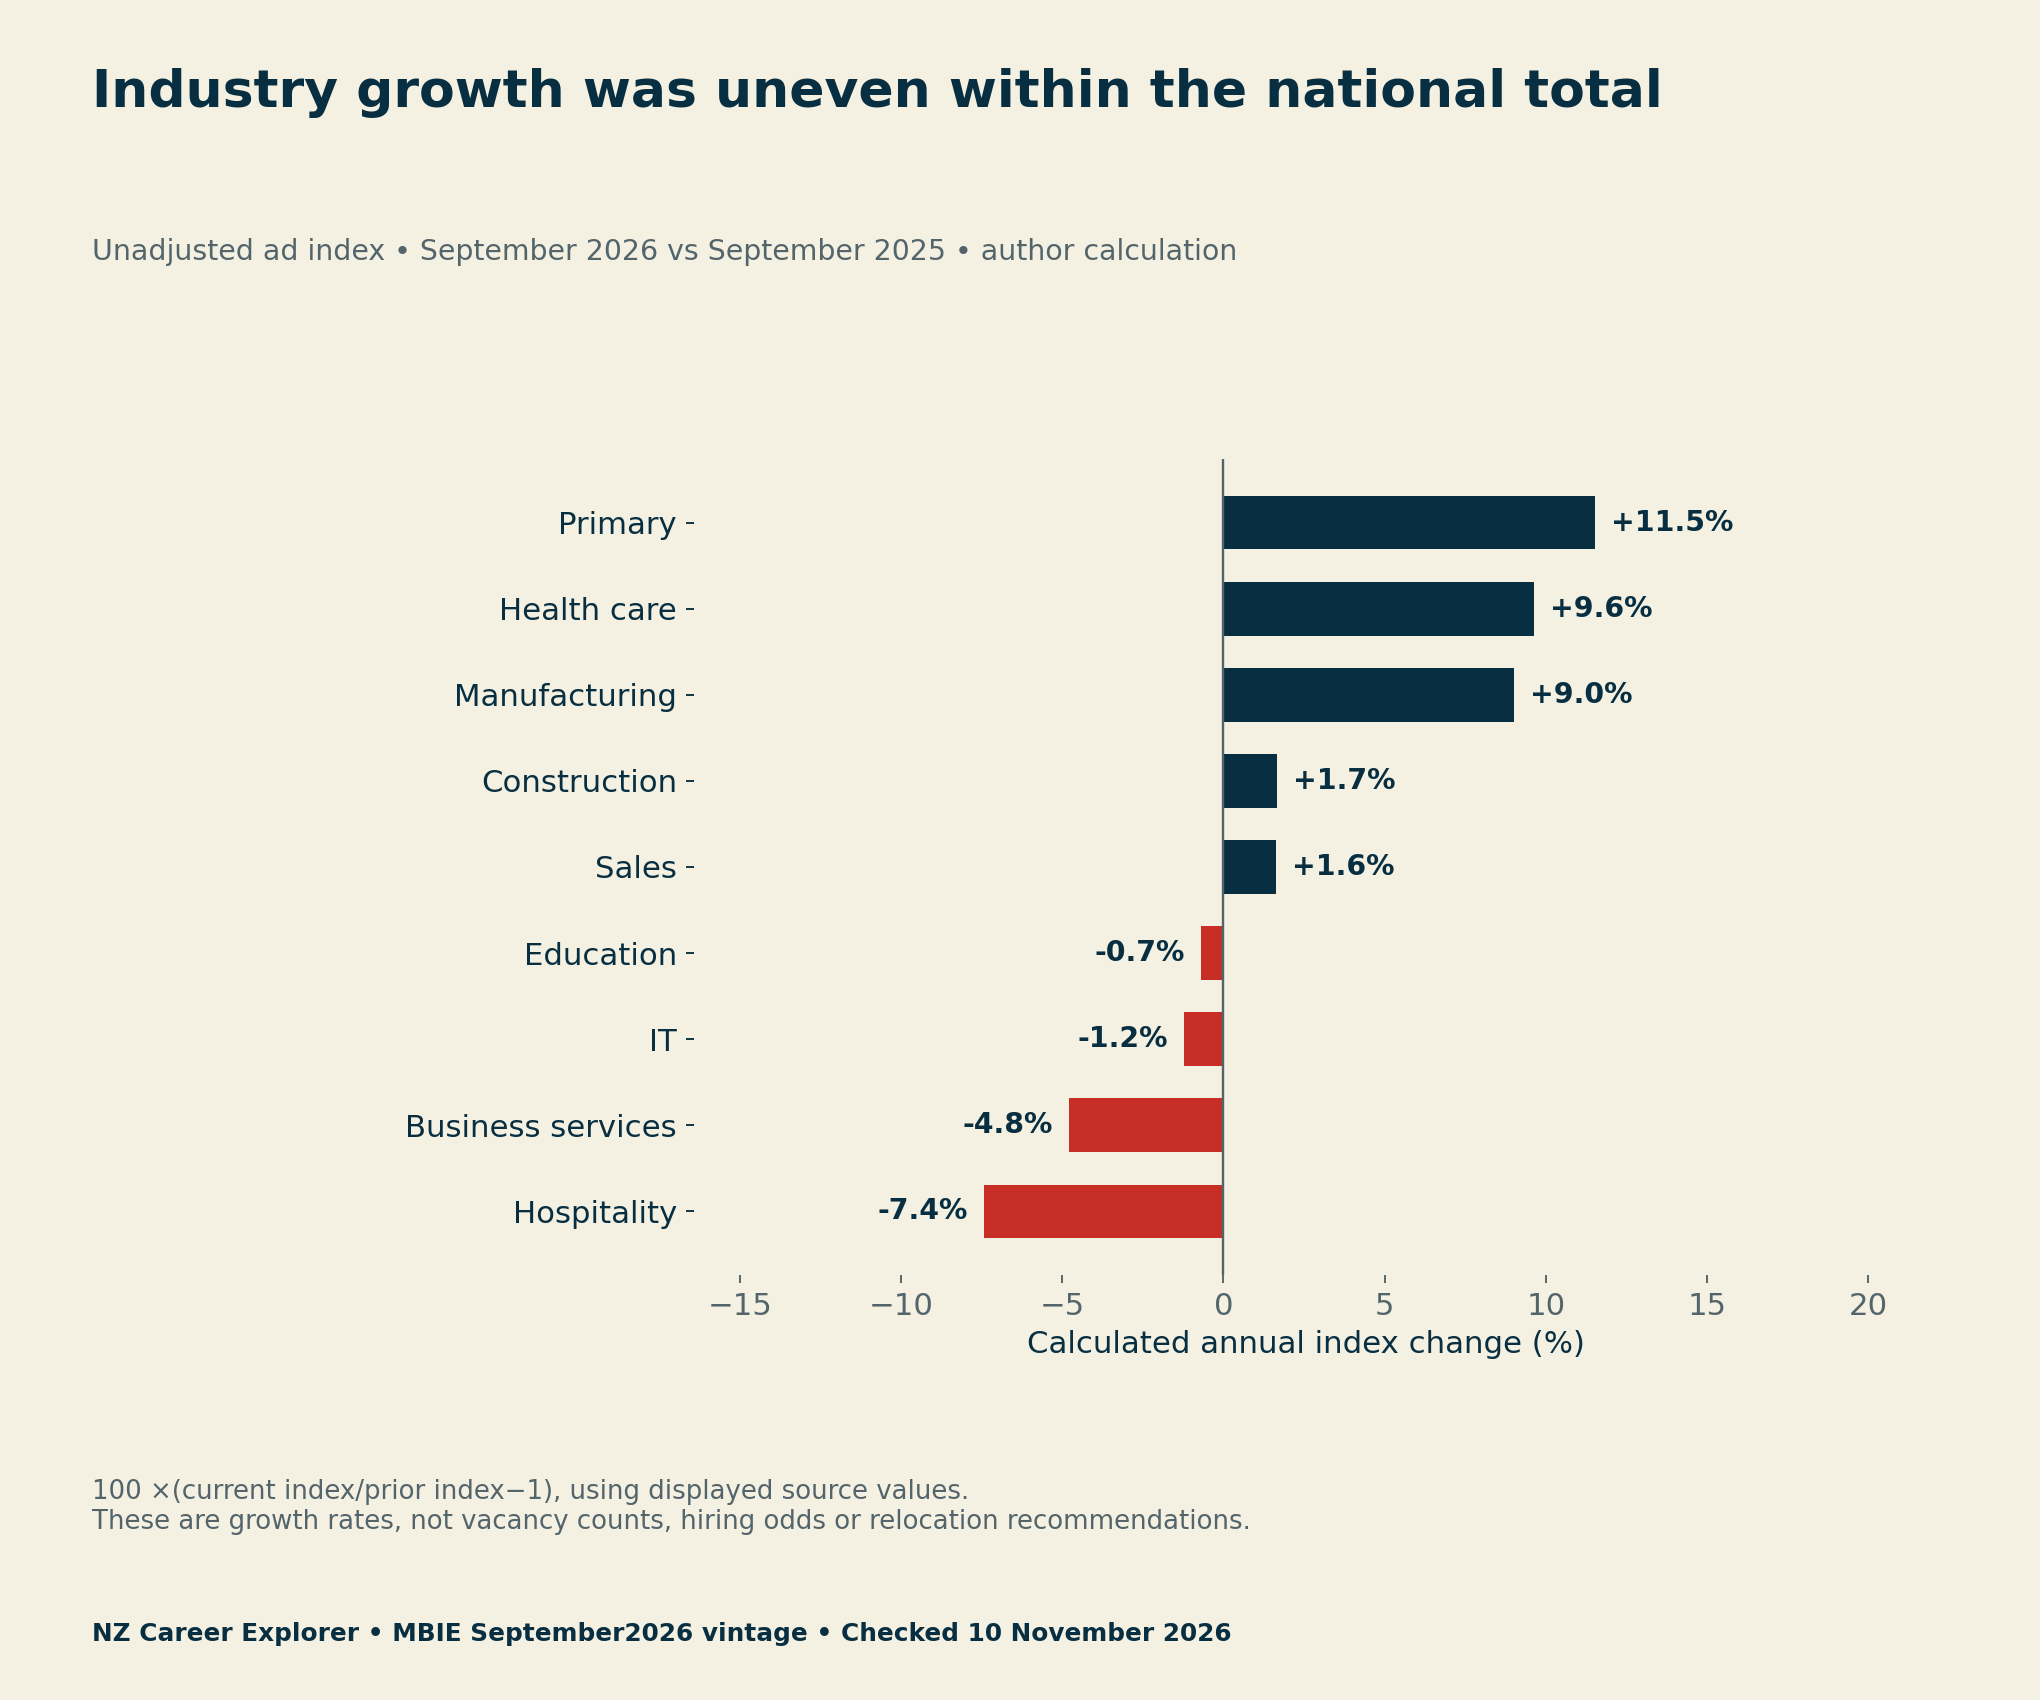
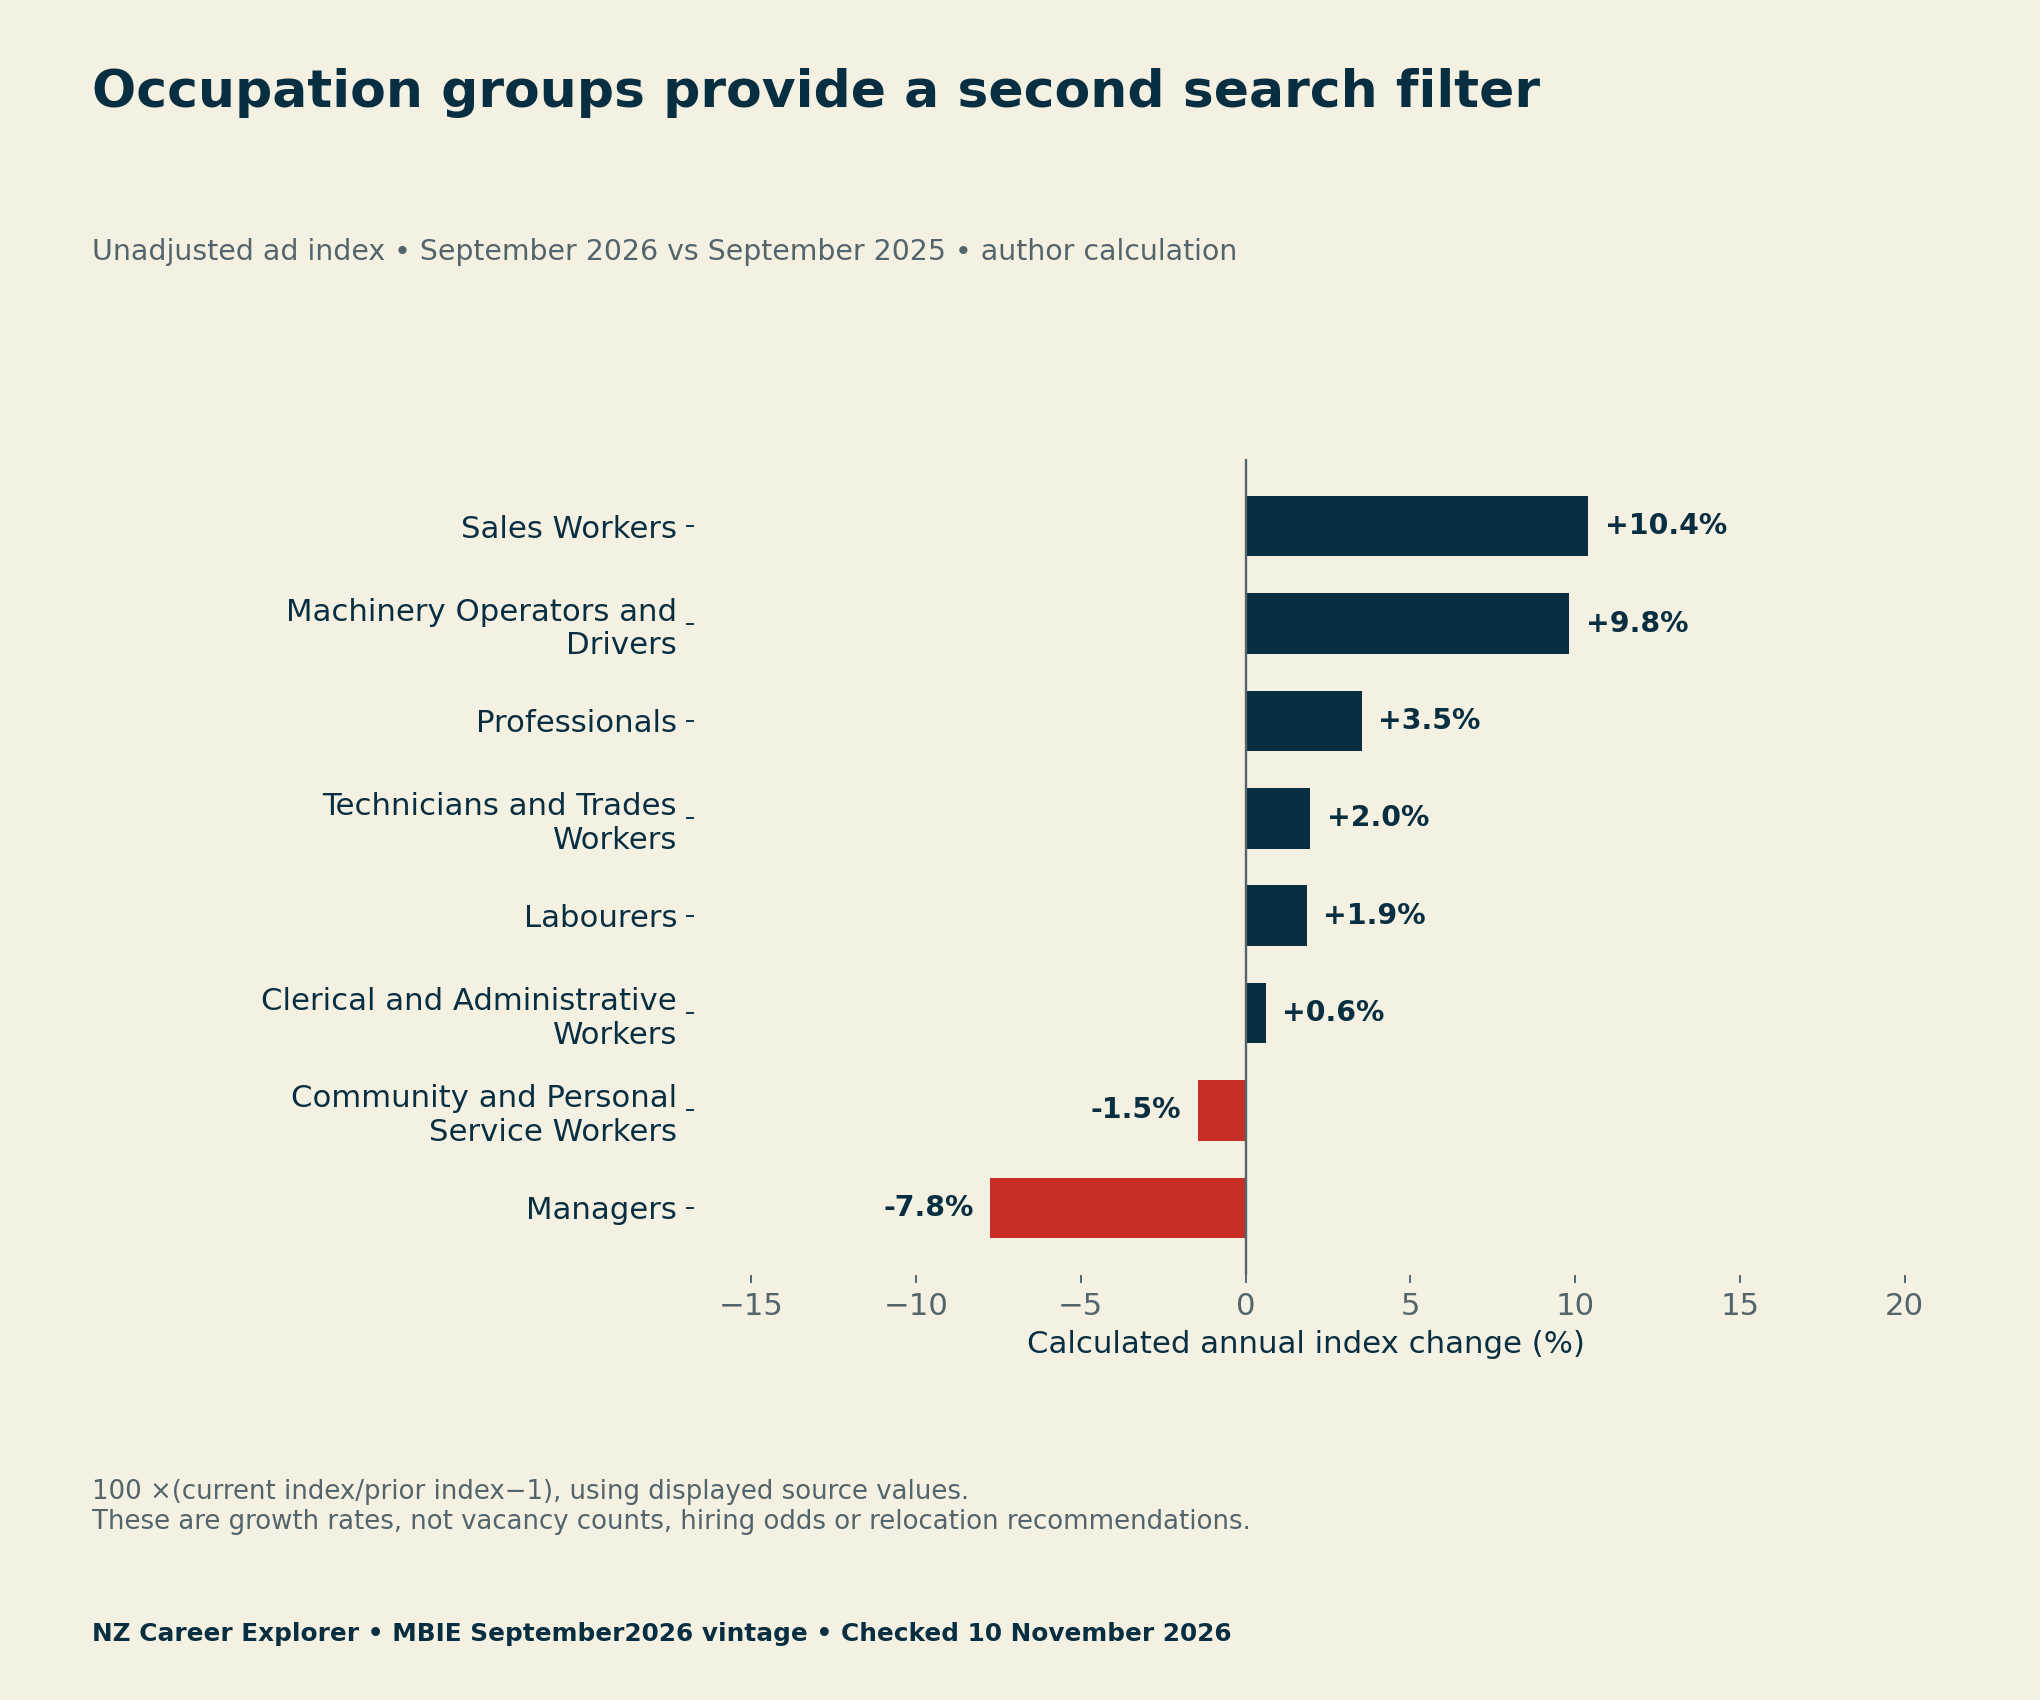
The same current file lets us calculate annual industry changes on a consistent basis. Primary rises about 11.5%, health care 9.6% and manufacturing 9.0%. Hospitality falls 7.4%. These describe advertising indices. They do not measure employment growth, wages, business survival or the chance that an applicant meets a role’s requirements.
Occupations supply another useful distinction. Sales workers rise about 10.4% and machinery operators and drivers 9.8%, while managers fall 7.8%. A person should check tasks, experience and required evidence rather than treating the broadest growing occupational label as a qualification they already hold.
Build a shortlist from three kinds of evidence
Use NZ job ads by region to choose what to investigate, then add occupational fit and employer evidence. Record the original employer role URL, checked date, essential qualifications, work eligibility, advertised pay and guaranteed hours. If a field is unknown, leave it unresolved. Do not turn an empty cell into zero.
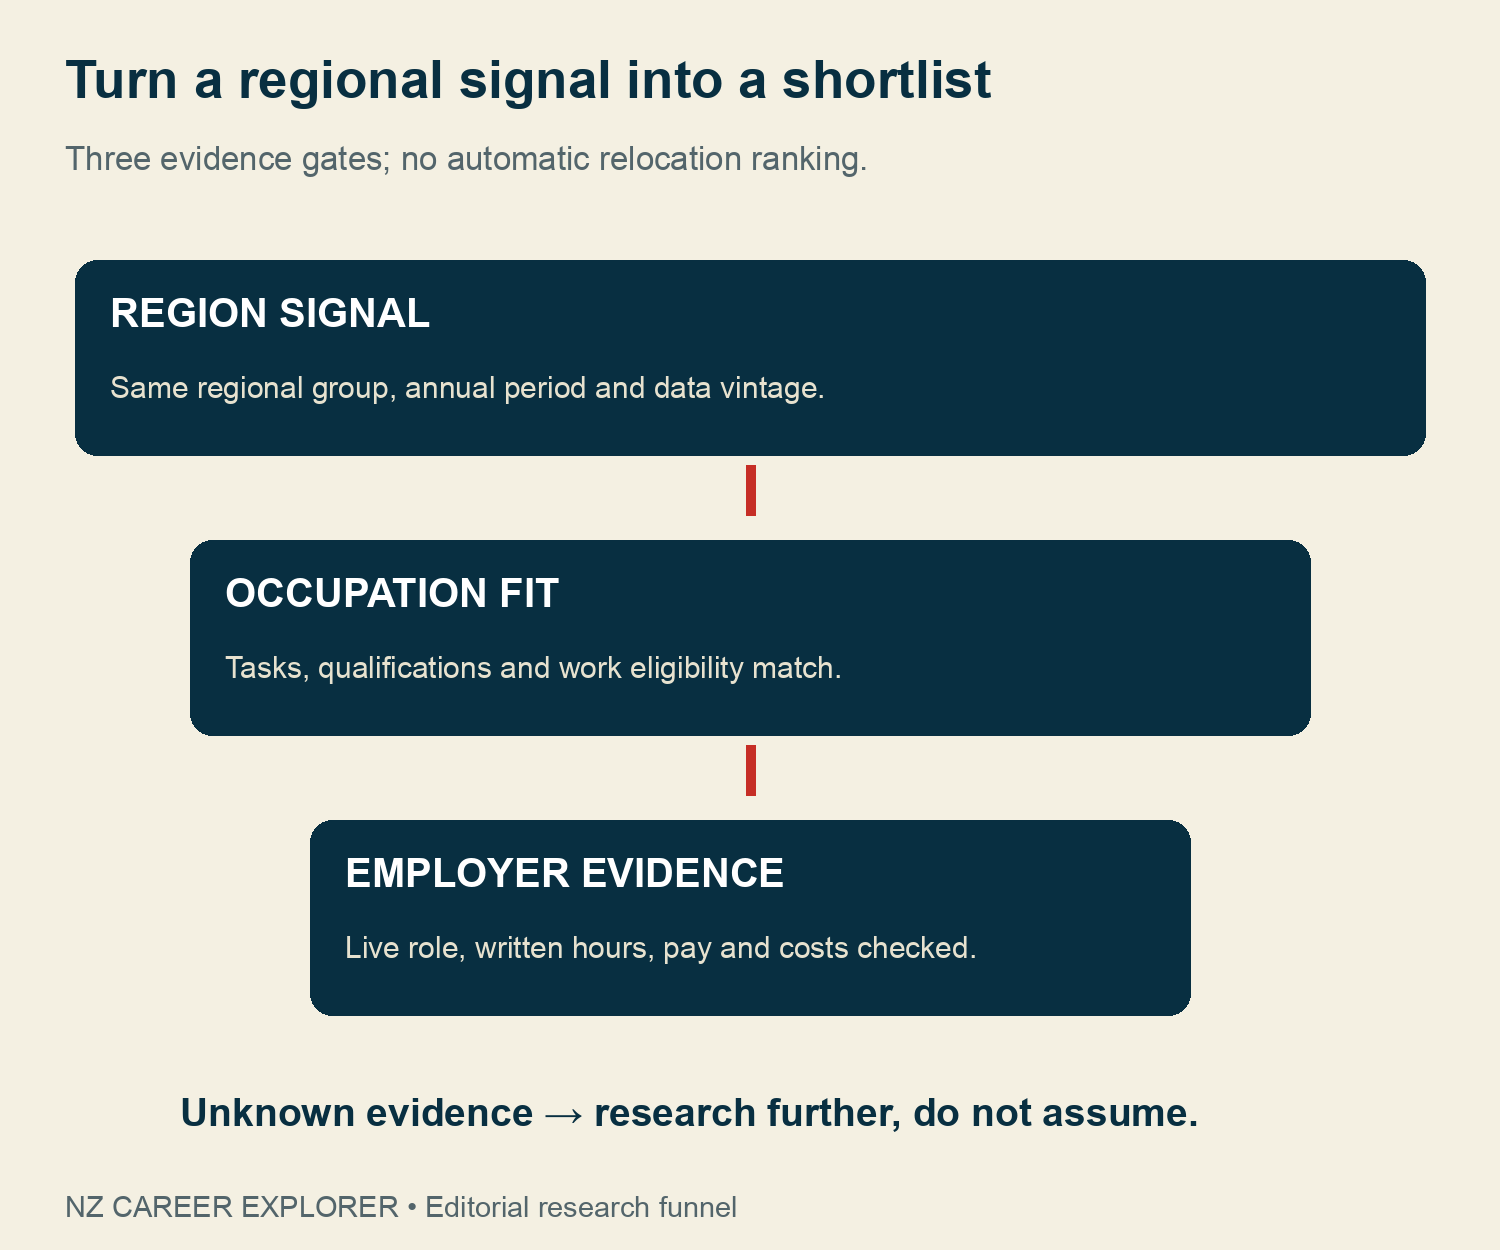
For a possible move, investigate rent, travel, transport, deposit costs and the start date using current evidence. Compare written offers over the same horizon if offers become available. This report has not collected a relocation budget or a representative vacancy sample, so it cannot tell you that a move pays for itself.
Newcomers should separately confirm any work conditions, qualification recognition or occupational registration that apply to the actual role. A positive ad index is not evidence of immigration eligibility or permission to practise. Use the relevant official agency and employer requirements when a concrete role is found.
Personalized Career Consulting
Unlock your potential with expert career advice tailored to your goals. Get personalized guidance and actionable steps toward your dream career in New Zealand.
Get StartedAdvertising, filled jobs and application outcomes differ
Our September filled-jobs analysis measures a different part of the labour market. Filled jobs describe recorded work, while this article examines advertising. Neither source measures the quality of your CV, the outcome of a specific application or an employer’s willingness to offer you guaranteed hours.
Jobs Online draws on SEEK, Trade Me Jobs, Education Gazette and Kiwi Health Jobs, with duplicate ads removed. It remains an index and a proxy for labour demand. Some work is advertised elsewhere. The current quarterly series is unadjusted, so we use annual comparisons to reduce seasonal confusion.
Download the regional data and research tools
- MBIE annual comparisons: regions, industries and occupations (CSV)
- Jobs Online headlines and breadth calculations (CSV)
- Blank region–occupation research worksheet (CSV)
- Job advertising measure dictionary (CSV)
Method, access limits and update trigger
Research checked 10 November 2026. We retained the full September quarterly CSV and checked unique date–group–series keys, positive-category counts and annual-ratio inputs. Regional percentages reconcile with the overview’s eight-positive/two-negative pattern. The national calculation reconciles with its rounded 2% headline. After MBIE’s processing change, the whole current series replaces older data.
The official PDF link returned an access-response page through direct binary retrieval. We do not claim to have retained or independently checked its full regional table. Our detailed charts use the downloaded CSV and are labelled as author calculations. A future data revision or quarterly release should trigger a fresh full-vintage extraction, not a single-row append.
Suggested citation: NZ Career Explorer, “NZ Job Ads by Region: Where to Focus Your Search in Late 2026,”10 November 2026. Cite MBIE for the underlying indices and this report for the calculations and worksheet. For a correction, provide the series, date and source through our contact page; keep private application documents out of public messages.


