





The NZ job market September 2026 release gives jobseekers a starting point for sector research. Filled jobs rose nationally, and five industries recorded notable annual gains. However, an increase in recorded employment does not tell you which vacancies are open or whether a particular role fits your experience.
Use three evidence columns: employment recorded, current employer advertisements and your demonstrated fit. A sector signal can guide what to investigate. A verified role and relevant evidence are needed before it becomes an application shortlist.
This report recalculates the published industry changes from the official CSV, charts the monthly national series and provides a blank application-research sheet. It also flags a source-date trap: MBIE’s displayed 7% advertising-growth summary still concerns June, not September.
Checked 31 October 2026. September observations were released by Stats NZ on 28 October. No employer-advertisement sample or application-success survey was conducted for this article.
What increased in the NZ job market September 2026 release?
The Stats NZ employment indicators release reports a monthly gain of 7,227 seasonally adjusted filled jobs, or 0.3%, from August to September. The official dataset gives a September level of 2,363,230. This comparison adjusts for recurring seasonal patterns.
A separate comparison uses actual filled jobs: 2,348,883 in September 2026, up 22,791, or 1.0%, from September 2025. Actual and seasonally adjusted figures answer different questions. Do not subtract one from the other and describe the difference as a fresh change in employment.
Five industry gains worth investigating
Public administration and safety added 6,041 actual filled jobs over the year. Health care and social assistance added 5,942. Construction gained 2,480, education and training 2,386, and administrative and support services 1,642. These are the five industries highlighted in the release, rather than a list of available vacancies.
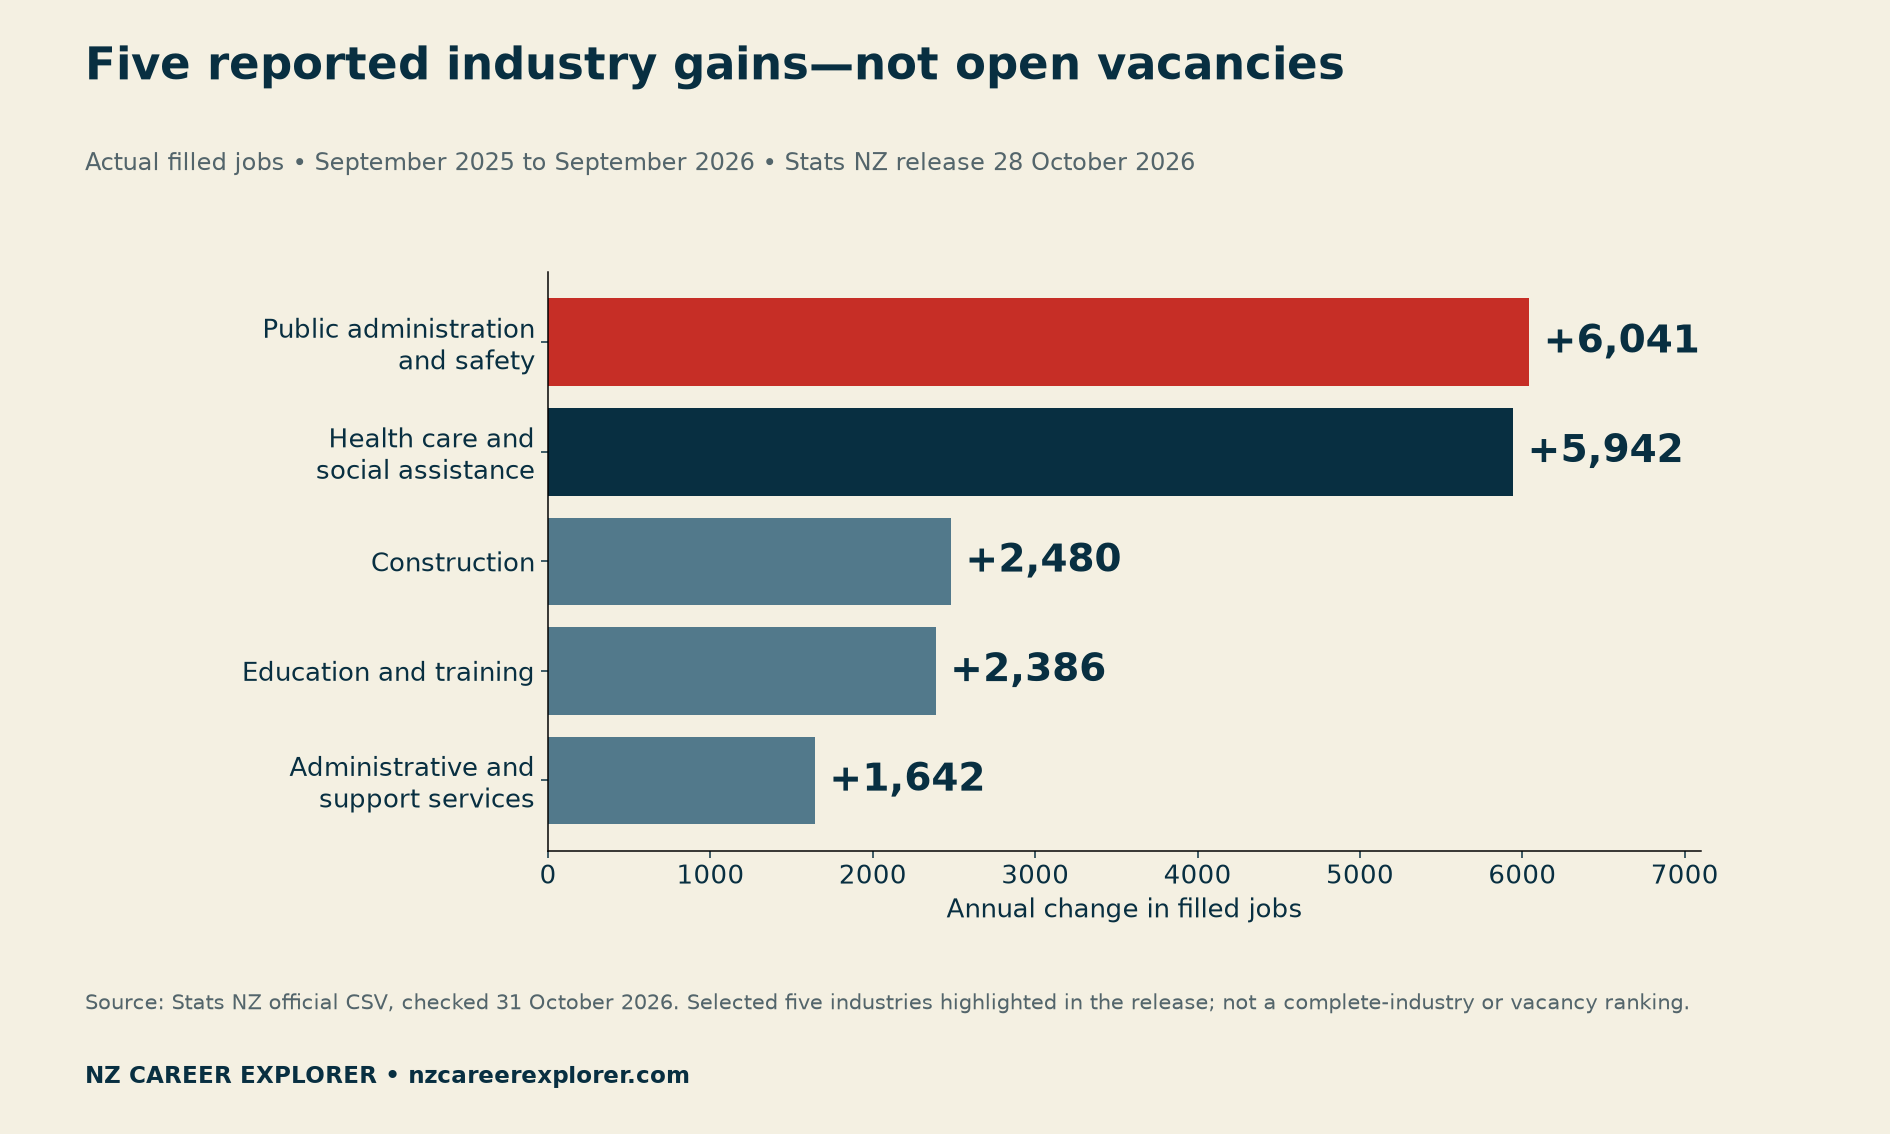
Broad industries contain very different occupations. A health-sector increase does not establish demand for every clinical, administrative or technical role within that sector. Similarly, construction includes work with different locations, credentials and contract conditions. Use the category to formulate a search question, not to assume a personal opportunity.
For public-service work, our Whaikaha internship comparison illustrates why a specific programme needs separate checks. Its advertised places, eligibility and fixed term come from employer material. They cannot be inferred from a national industry total.
Why job counts and growth rates tell different stories
The same five industries grew by 3.7%, 2.1%, 1.3%, 1.1% and 1.7%, respectively. A count measures the size of the change. A percentage relates that change to the earlier industry total. Keeping them separate avoids treating a large industry’s gain as automatically the fastest expansion.
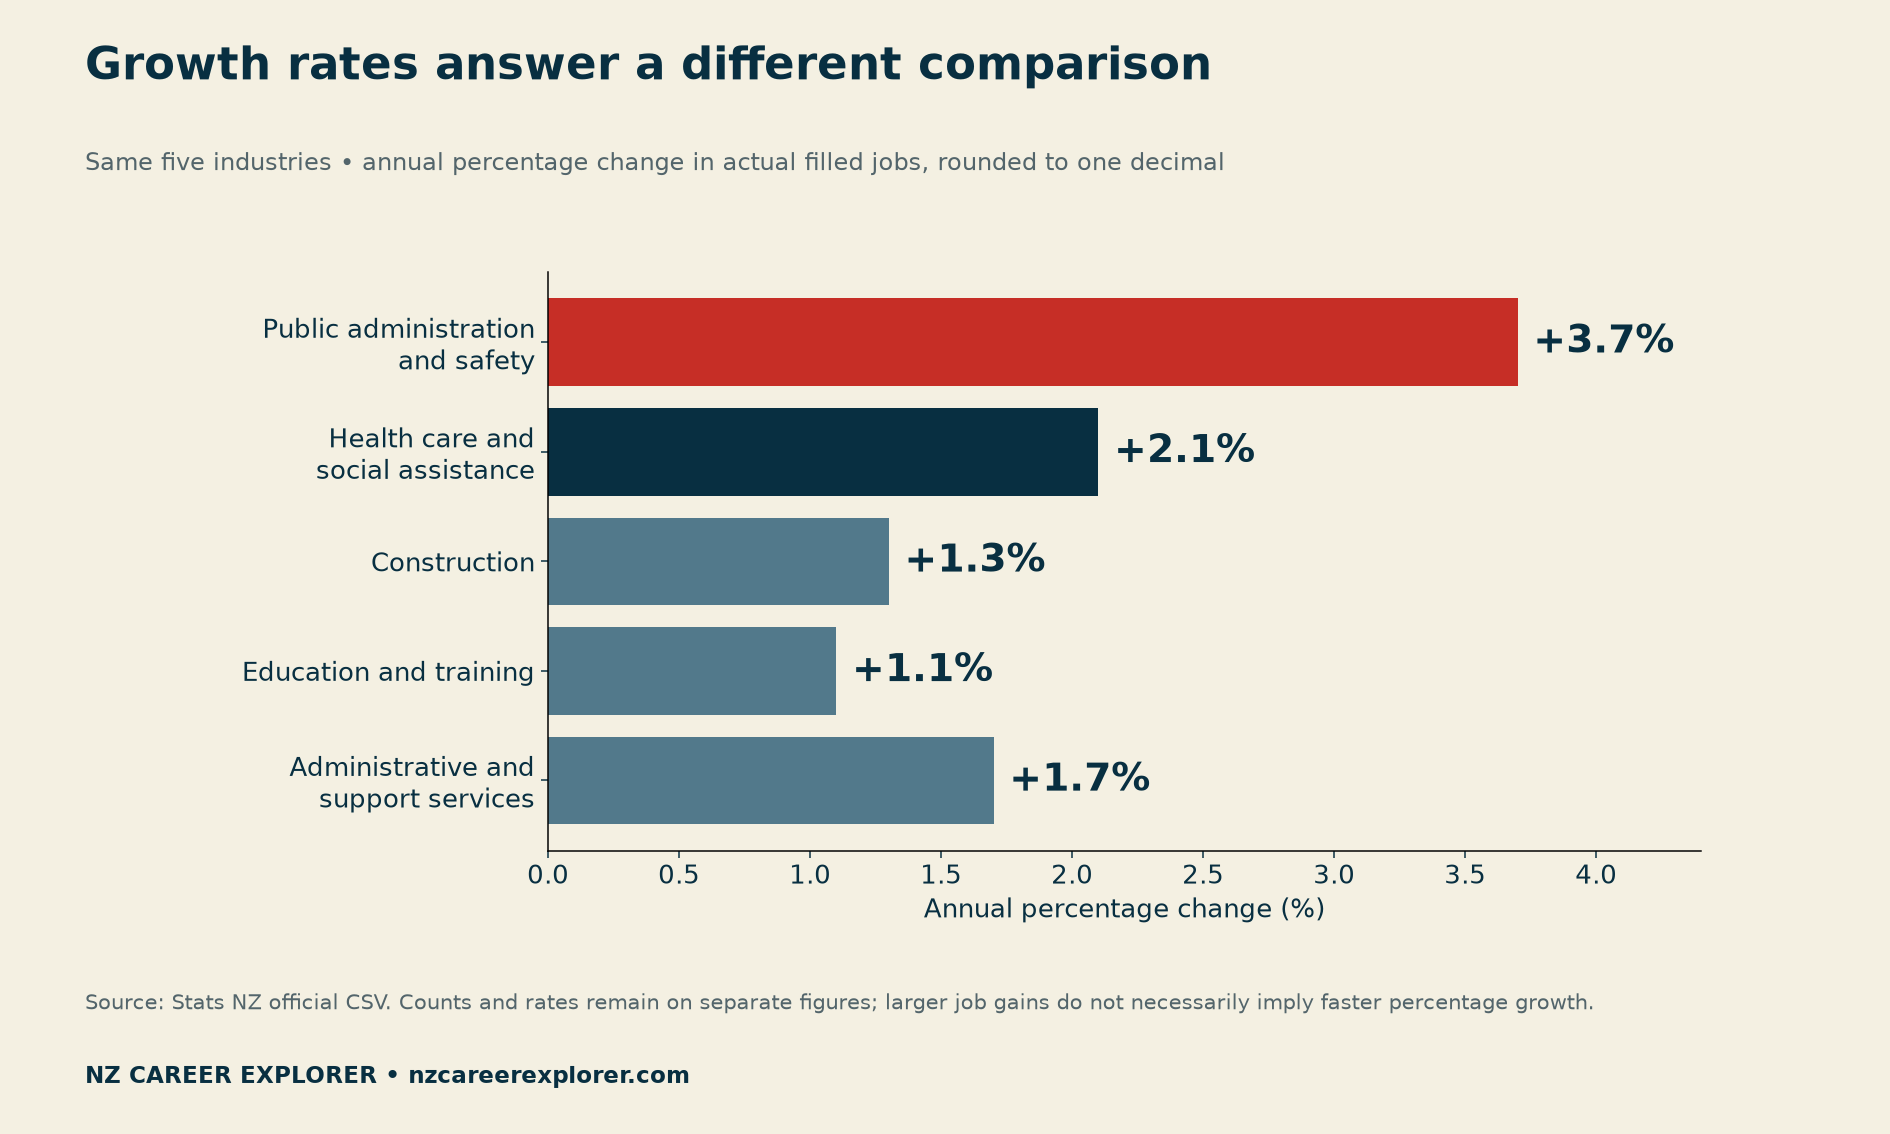
For example, education gained more filled jobs than administrative and support services. Yet its percentage increase was smaller. Neither comparison ranks the accessibility of a role for you. Requirements, location and the work you can demonstrate remain separate questions.
Read the monthly national path alongside the annual comparison
A single positive month cannot establish that every sector or location is improving. The national line below retains the monthly seasonally adjusted series from September 2023 through September 2026. It helps readers place the latest increase within a longer path, without mixing it with the annual actual-industry comparison.
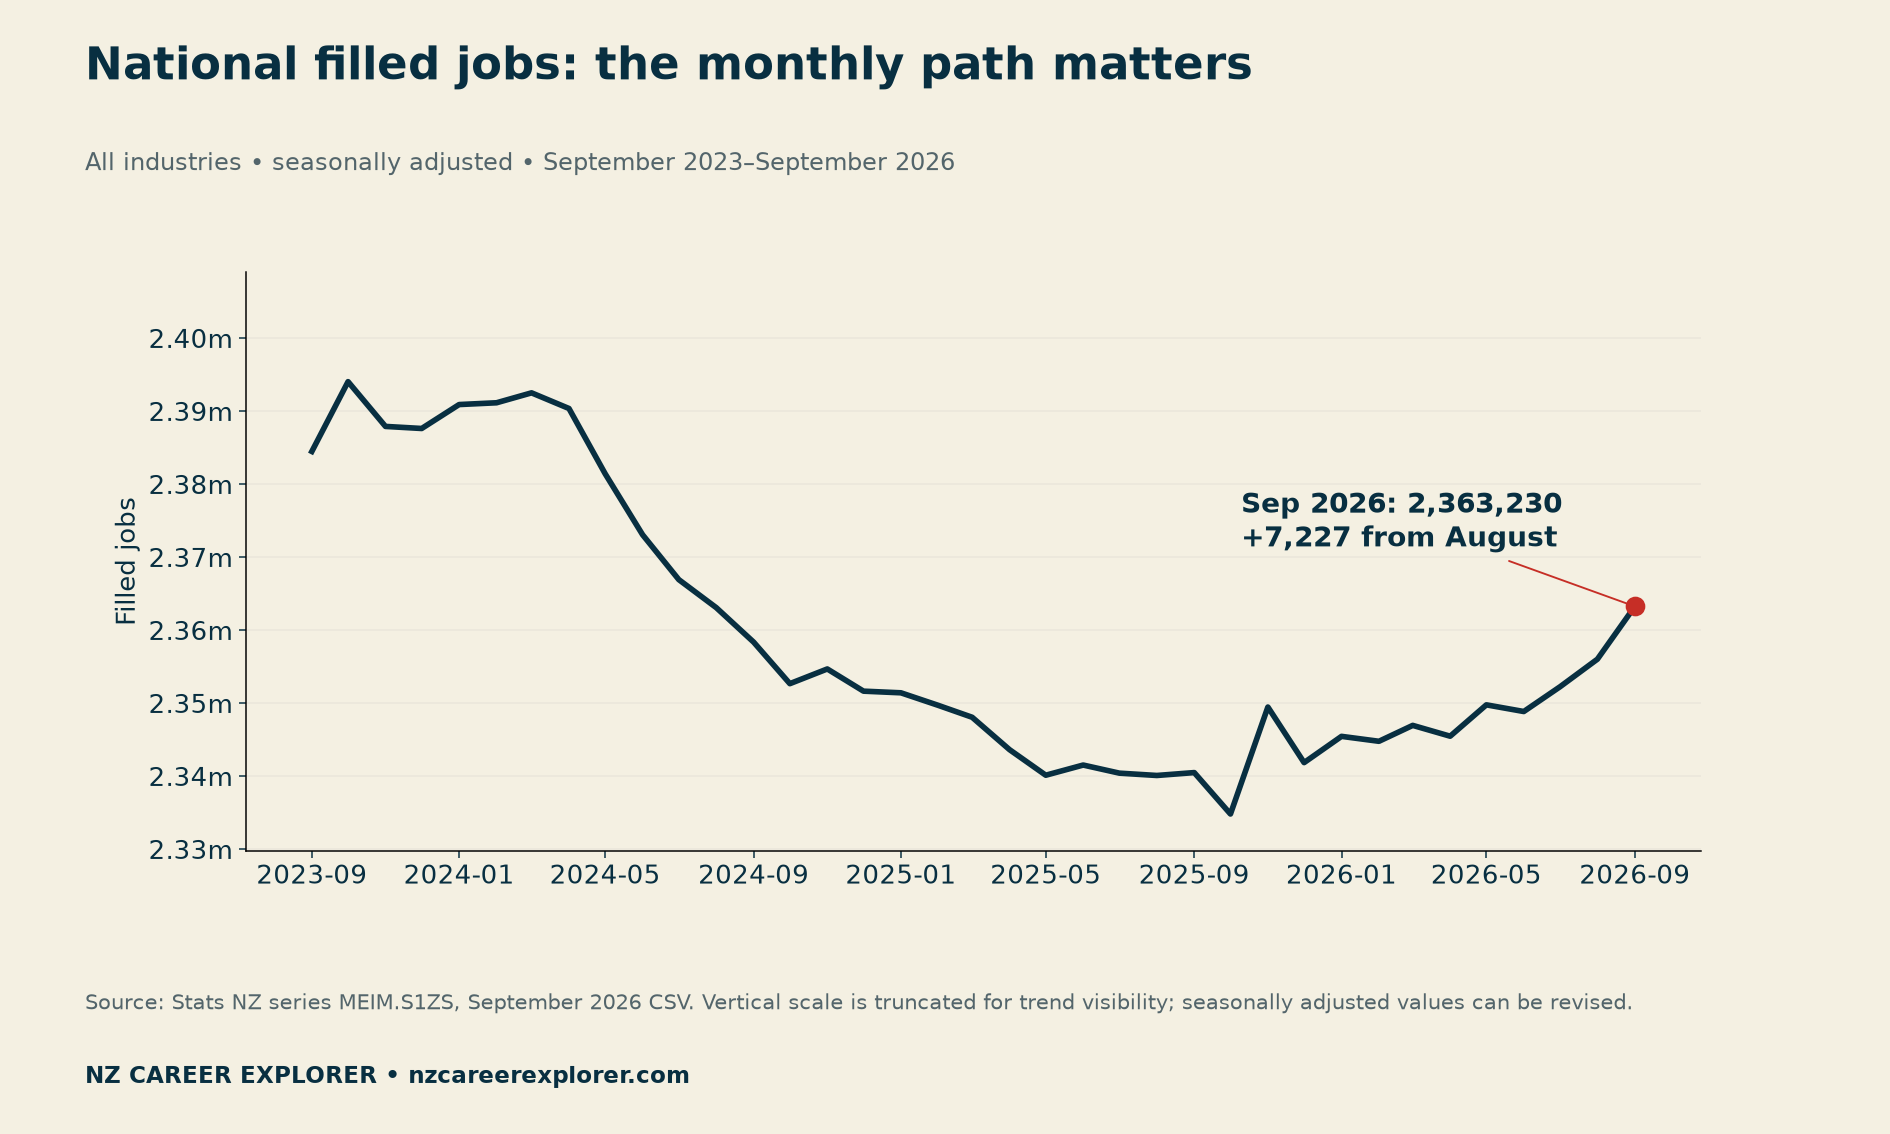
The downloadable series preserves exact values and source identifiers. Use the same release version when checking a change. Comparing a current September estimate with an older August download can introduce revisions into what looks like a simple monthly calculation.
Filled jobs also differ from unique employed people and unfilled vacancies. This report does not turn the release into a new unemployment-rate claim. Nor does it calculate your chance of an interview, because the dataset contains no applicant or interview outcomes.
Avoid MBIE’s June-to-September headline trap
The MBIE Jobs Online page says its September-quarter datasets were updated on 30 October. It also says the September narrative report is due on 6 November. At our check, the displayed 7% annual-growth summary is explicitly headed “Year ended June 2026 quarter.” It must retain that June label.
Personalized Career Consulting
Unlock your potential with expert career advice tailored to your goals. Get personalized guidance and actionable steps toward your dream career in New Zealand.
Get Started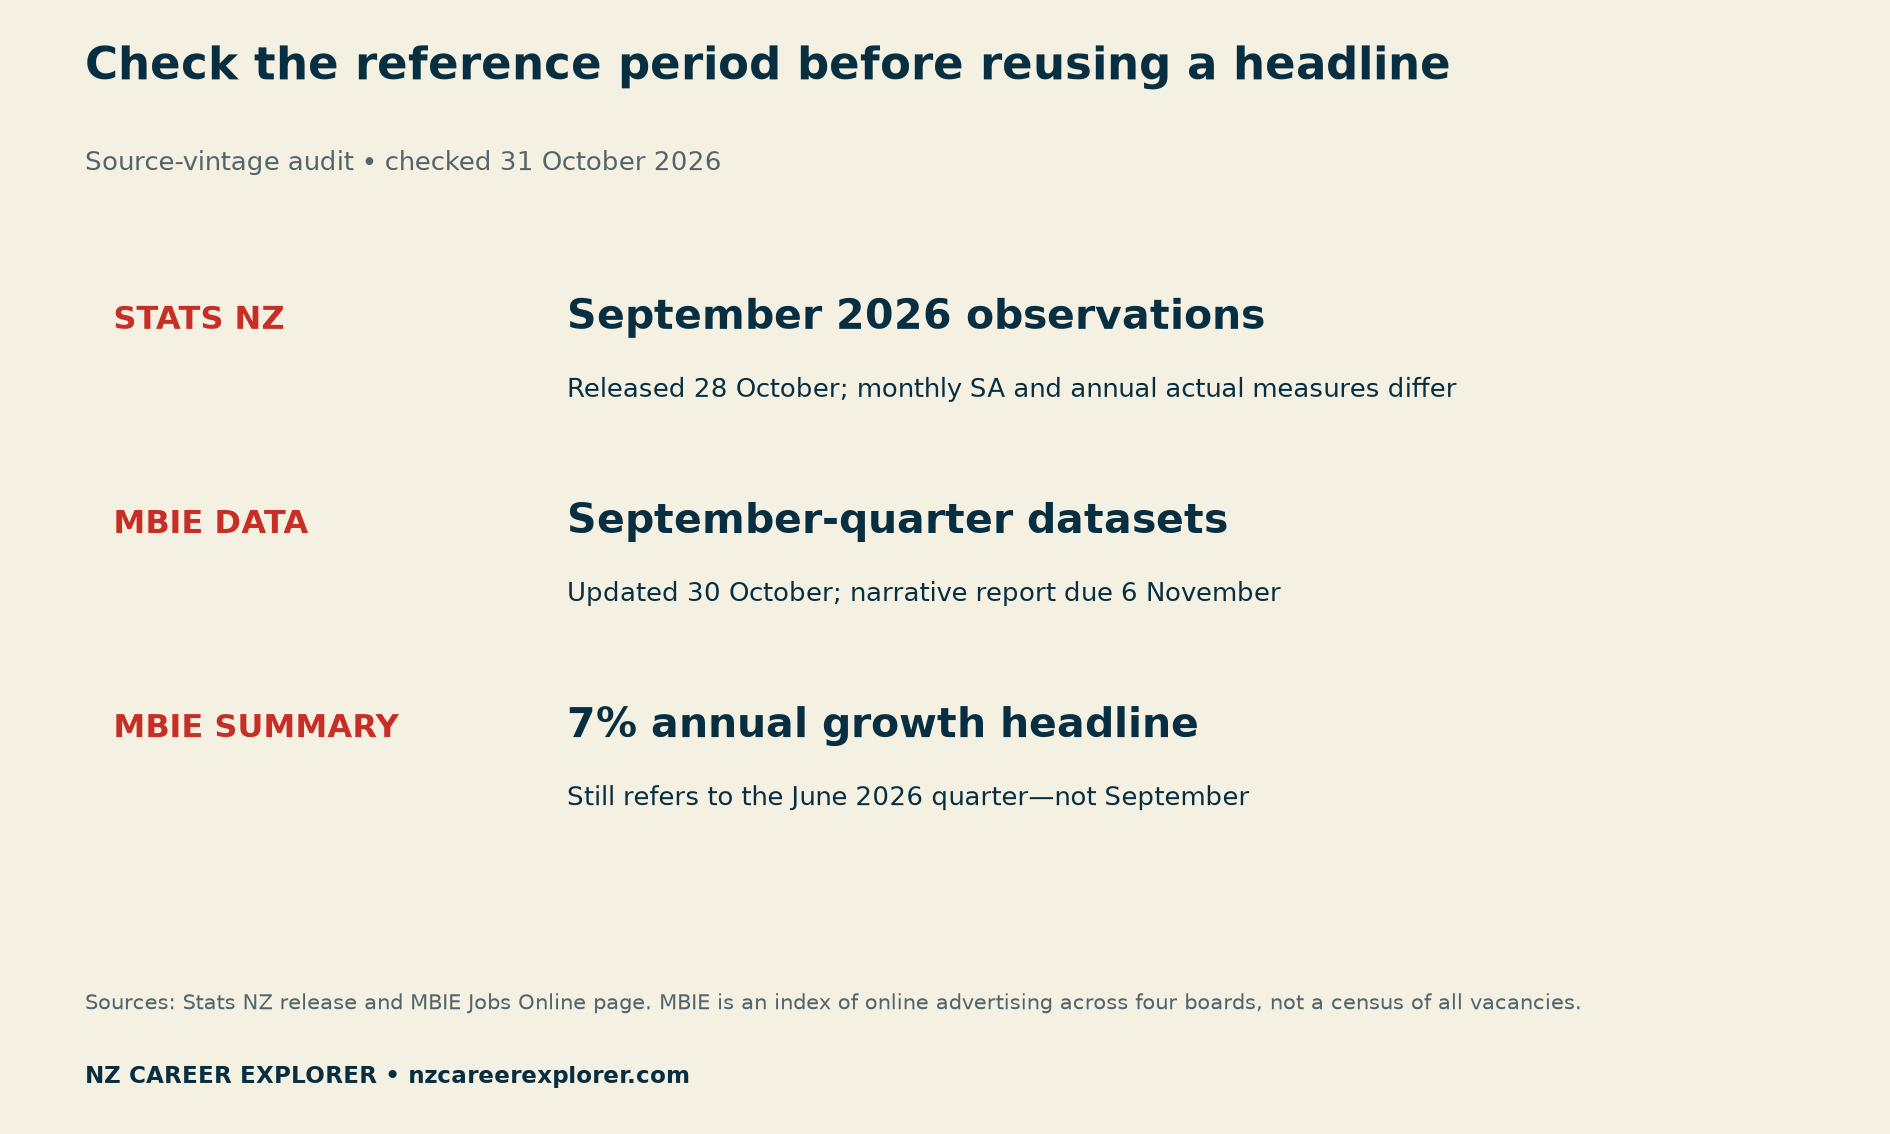
Jobs Online tracks an advertising index across SEEK, Trade Me Jobs, Education Gazette and Kiwi Health Jobs. It is not a count of every vacancy in New Zealand. Its quarterly series are unadjusted, and MBIE recommends annual comparisons to avoid seasonal effects. This article does not manufacture a September advertising-growth rate from the older summary.
When updating the evidence, log four fields: publication date, reference period, adjustment status and download version. If the narrative and data have different release dates, preserve the distinction. Do not copy a prominent number without reading its heading and definition.

Build an application shortlist with three evidence columns
First, write down the sector signal you want to investigate, including its period and measure. This prevents a broad growth headline from becoming an unsupported claim that a particular occupation is hiring.
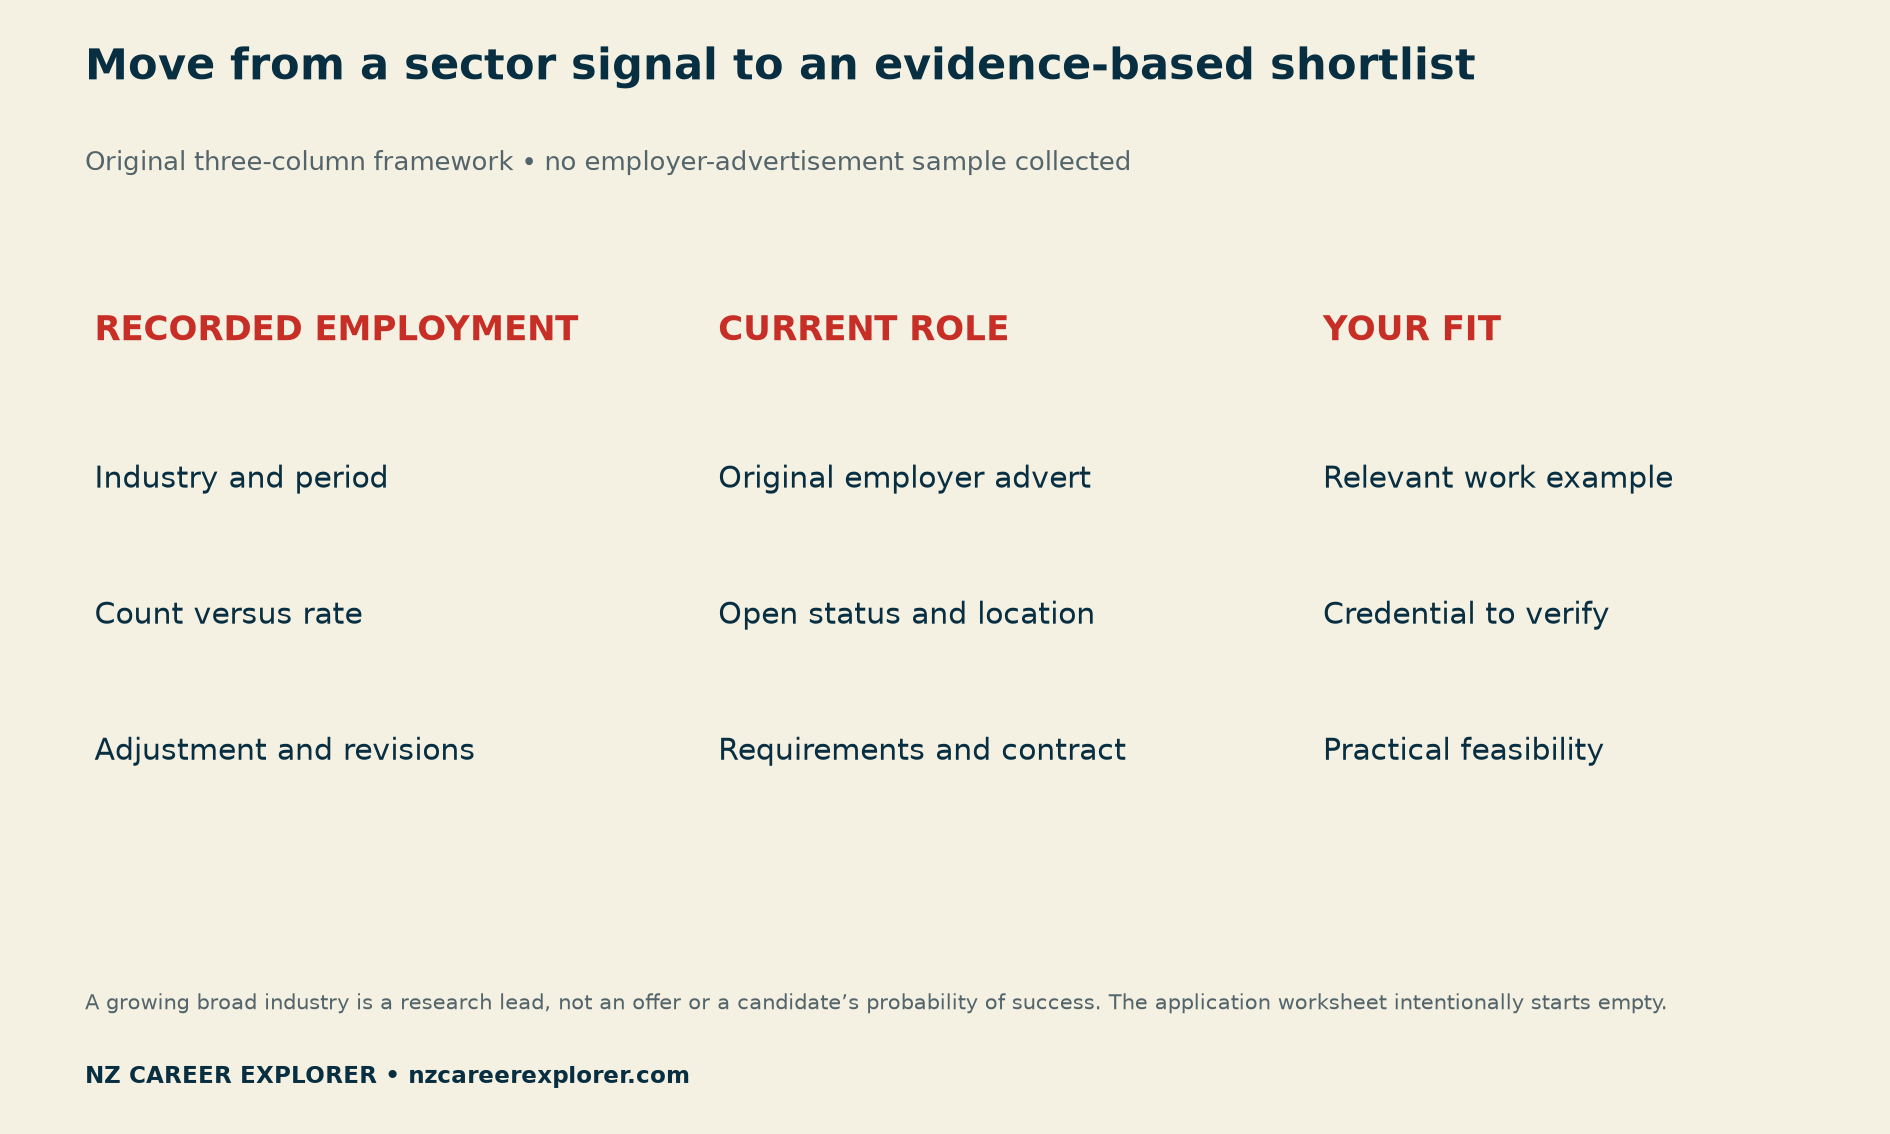
Second, find a current role through the employer’s original recruitment route. Record the reference, posting date, location, deadline and open status. If another site repeats the advertisement, retain the duplicate reference rather than counting it as a second opportunity.
Third, match the actual tasks to a work or study example. Explain your contribution, the method and the result you can substantiate. Record a credential question as unresolved until the employer or responsible official body answers it. National growth cannot establish recognition of an overseas qualification or sponsorship for a newcomer.
Practical feasibility belongs in this check too. Confirm hours, contract duration and location before comparing options. When an offer supplies actual pay and working hours, our NZ pay-rise calculator guide provides a separate way to assess purchasing power and time.
A transparent protocol for a future advert sample
A small employer-advertisement sample could add useful examples, but it would require fresh collection. Choose the sectors, search terms, location and collection date in advance. For instance, retain the first ten relevant, non-duplicate employer advertisements returned by a defined search in each chosen sector.
Save included advertisements and exclusions with reasons. Note whether a role is closed, geographically unsuitable or duplicated. Report how the search was ordered. Such a sample would illustrate that search on that date; it would not represent the national market. None of that sample work is claimed as completed here.
Download the data and research tools
Five-industry comparison and calculations (CSV) includes both September levels, annual changes, rounded rates and stable series references.
National monthly filled-job series (CSV) retains the 37 seasonally adjusted observations used in Figure 3, from one official release version.
Source-vintage register (CSV) separates the national monthly and annual measures from MBIE’s differently dated material.
Empty application-research sheet (CSV) provides fields for genuine employer advertisements, requirements, duplicate checks and evidence of fit. It contains no invented vacancy rows.
Methodology, revisions and limitations
We downloaded Stats NZ’s September 2026 CSV archive and used series identifiers to join the same industry across September 2025 and September 2026. Annual change equals the later count minus the earlier count. Percentage change equals the later count divided by the earlier count, minus one, multiplied by 100. The results reconcile to the release after rounding.
Stats NZ says actual values are provisional for three months. It also reports payroll-remediation cases that can overstate lower-level filled-job counts; identified cases are removed. These cautions matter when interpreting fine detail. We retain the source file and extraction date so the comparison can be reproduced.
Transform Your Career with a Professional CV and Cover Letter
Stand out to employers with an ATS-optimized resume and tailored cover letter designed to match your dream role. Let us craft your job application materials for success!
Get StartedOur original contribution is the reproducible comparison, source-vintage audit and three-column research method. The figures do not measure application competition, individual suitability or guaranteed work. Suggested citation: NZ Career Explorer, “NZ Job Market September 2026: Where Filled Jobs Grew,” 31 October 2026, with underlying employment data attributed to Stats NZ.


