





An NZ public health analyst briefing example needs more than a national headline. The 2025/26 daily-smoking estimate is 5.9%, while the displayed Māori estimate is 13.9%. A useful briefing explains the measure, shows uncertainty and keeps a population comparison separate from claims about people or programme success.
The Ministry of Health published the smoking and vaping findings on 18 November 2026. Our worked example uses daily smoking among people aged 15 or older. It is an evidence-communication exercise for analysts and applicants, not clinical advice, a provider ranking or a vacancy announcement.
NZ public health analyst briefing example: define the population first
The survey methodology describes a multi-stage household survey of the usually resident population. Its adult questionnaire covers ages 15 and older. Estimates describe populations using the survey methods; they are not simply the proportion of interview forms in a folder.
Write the indicator, age scope, reference period and source release on the briefing before drafting a conclusion. In particular, 13.9% is a daily-smoking estimate for Māori adults in the stated survey scope. It is not the percentage of respondents who are Māori, nor the Māori share of all people who smoke.
Use the national series without hiding uncertainty
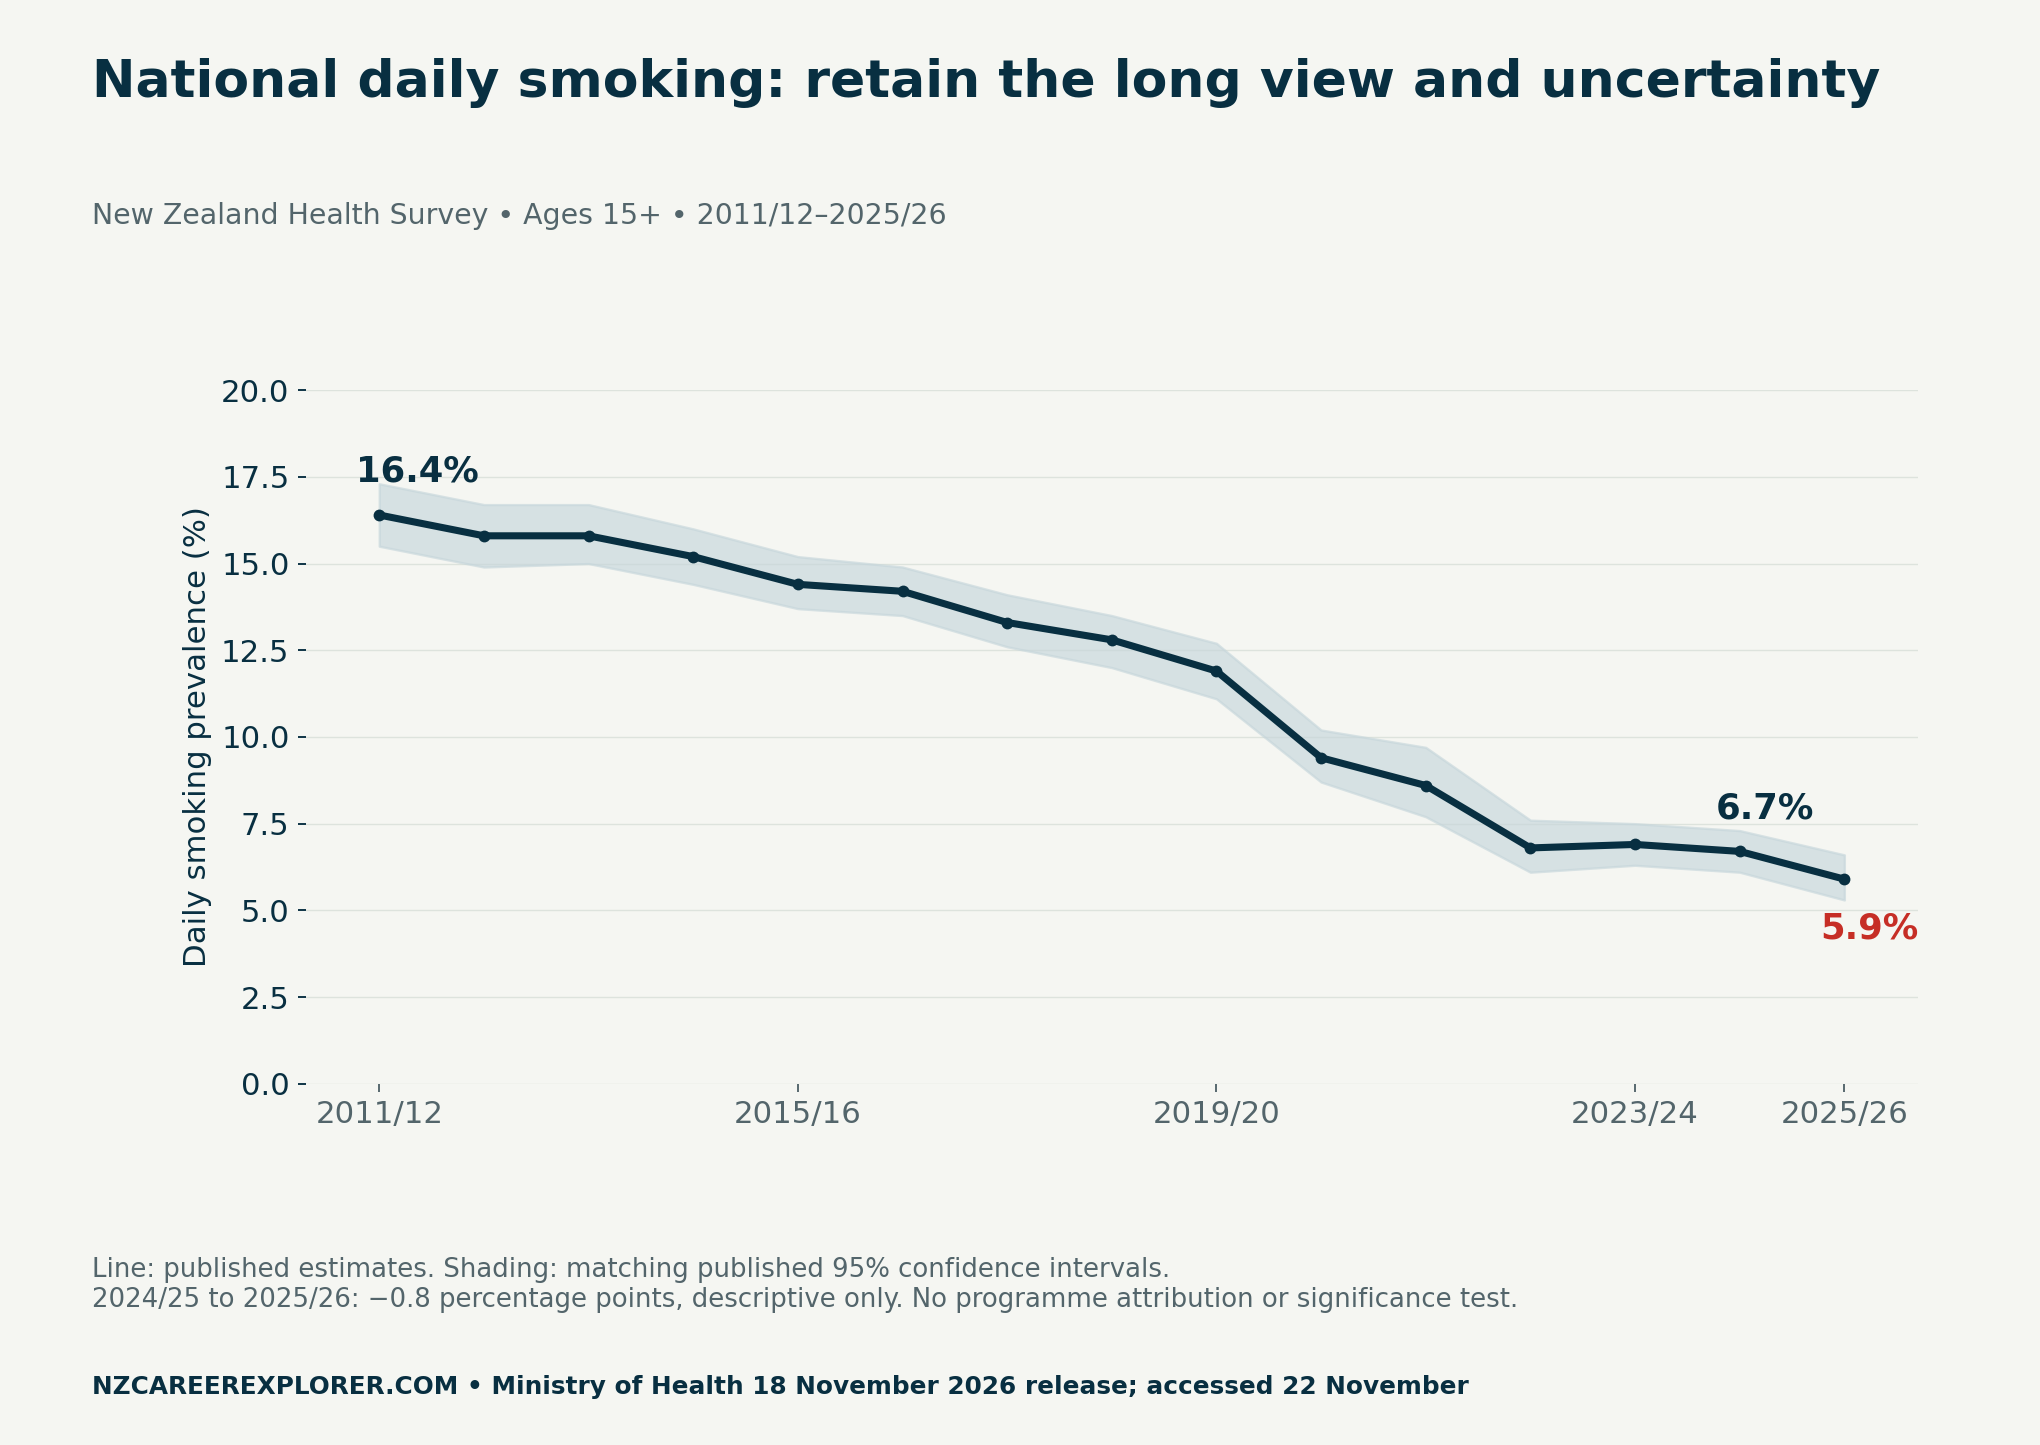
The current release reports 16.4% in 2011/12, 6.7% in 2024/25 and 5.9% in 2025/26. Subtracting the last two gives 5.9 − 6.7 = −0.8 percentage points. That arithmetic describes the displayed estimates; it does not itself test whether the population changed or explain why.
The annual results notes caution that survey estimates can fluctuate and advise against inferring a trend from fewer than three years. Our chart therefore retains the complete downloaded national series instead of drawing a long-term conclusion from just two points. It also uses the current release’s historical values consistently.
The national CSV includes the matching 95% confidence intervals. For 2024/25 they are 6.1–7.3%, and for 2025/26 they are 5.3–6.6%. We show those intervals, but do not infer a test of the difference from their overlap. That requires the relevant survey analysis and variance treatment.
Keep the group comparison in its own panel
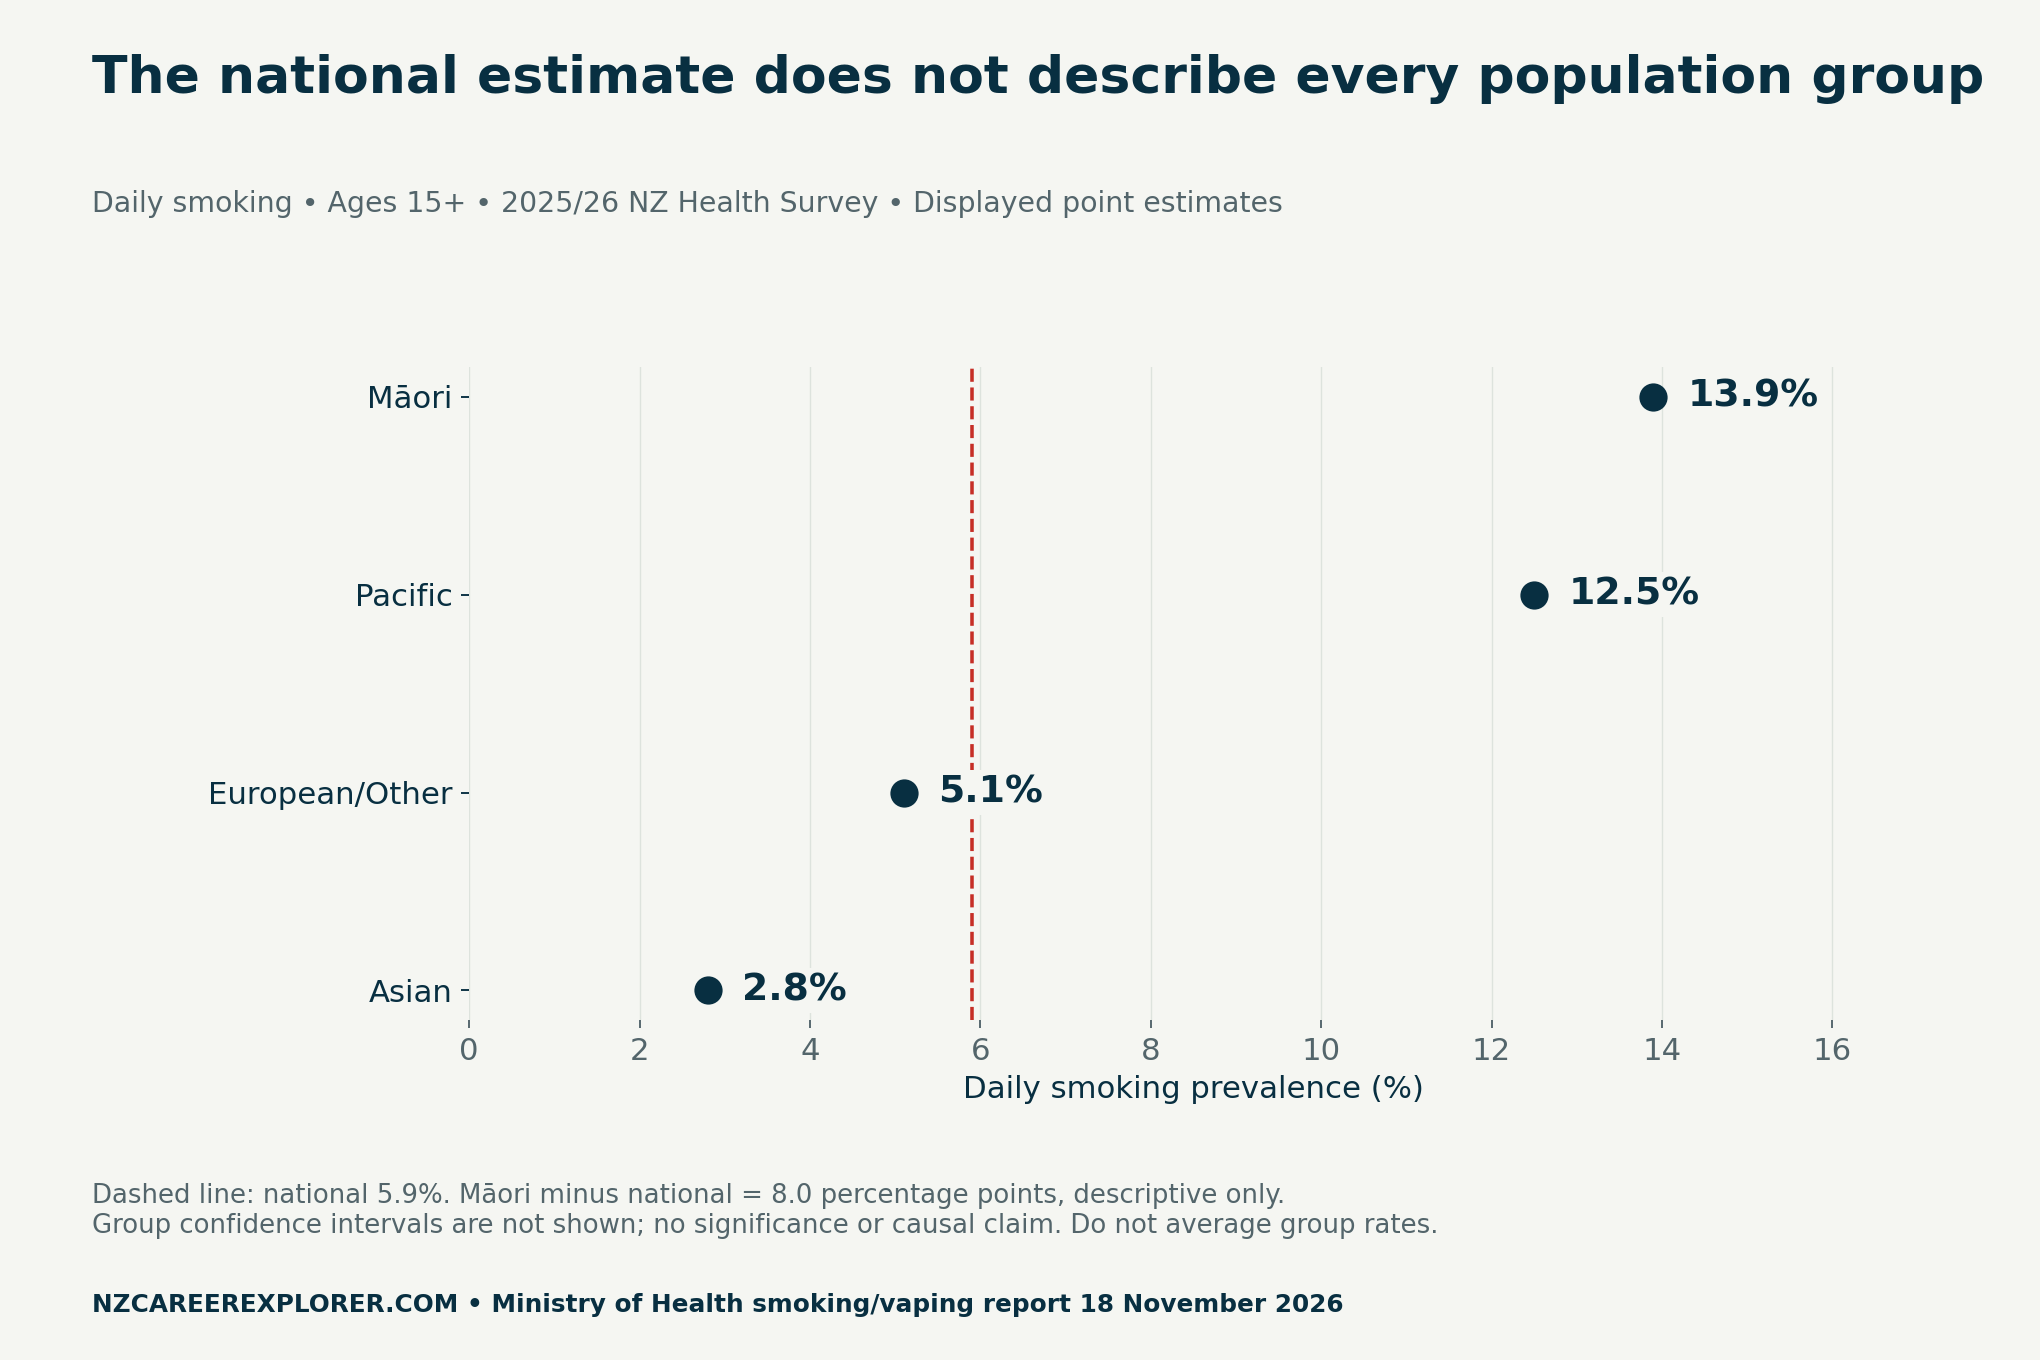
| Population | Displayed daily-smoking estimate | Period |
|---|---|---|
| Māori | 13.9% | 2025/26 |
| Pacific | 12.5% | 2025/26 |
| European/Other | 5.1% | 2025/26 |
| Asian | 2.8% | 2025/26 |
For the worked comparison, 13.9 − 5.9 = 8.0 percentage points. Label it Māori minus national, not an 8% increase. The national population includes Māori; it is not an independent non-Māori comparison. Do not silently change that comparator or call the subtraction age-adjusted.
Nor should you average the four displayed percentages to reconstruct the national result. A population-weighted survey estimate is not the simple mean of these figures. Keep denominator and classification notes with the source, and retrieve matching group uncertainty before making any inferential comparison.
Write an observation, a limitation and a next question
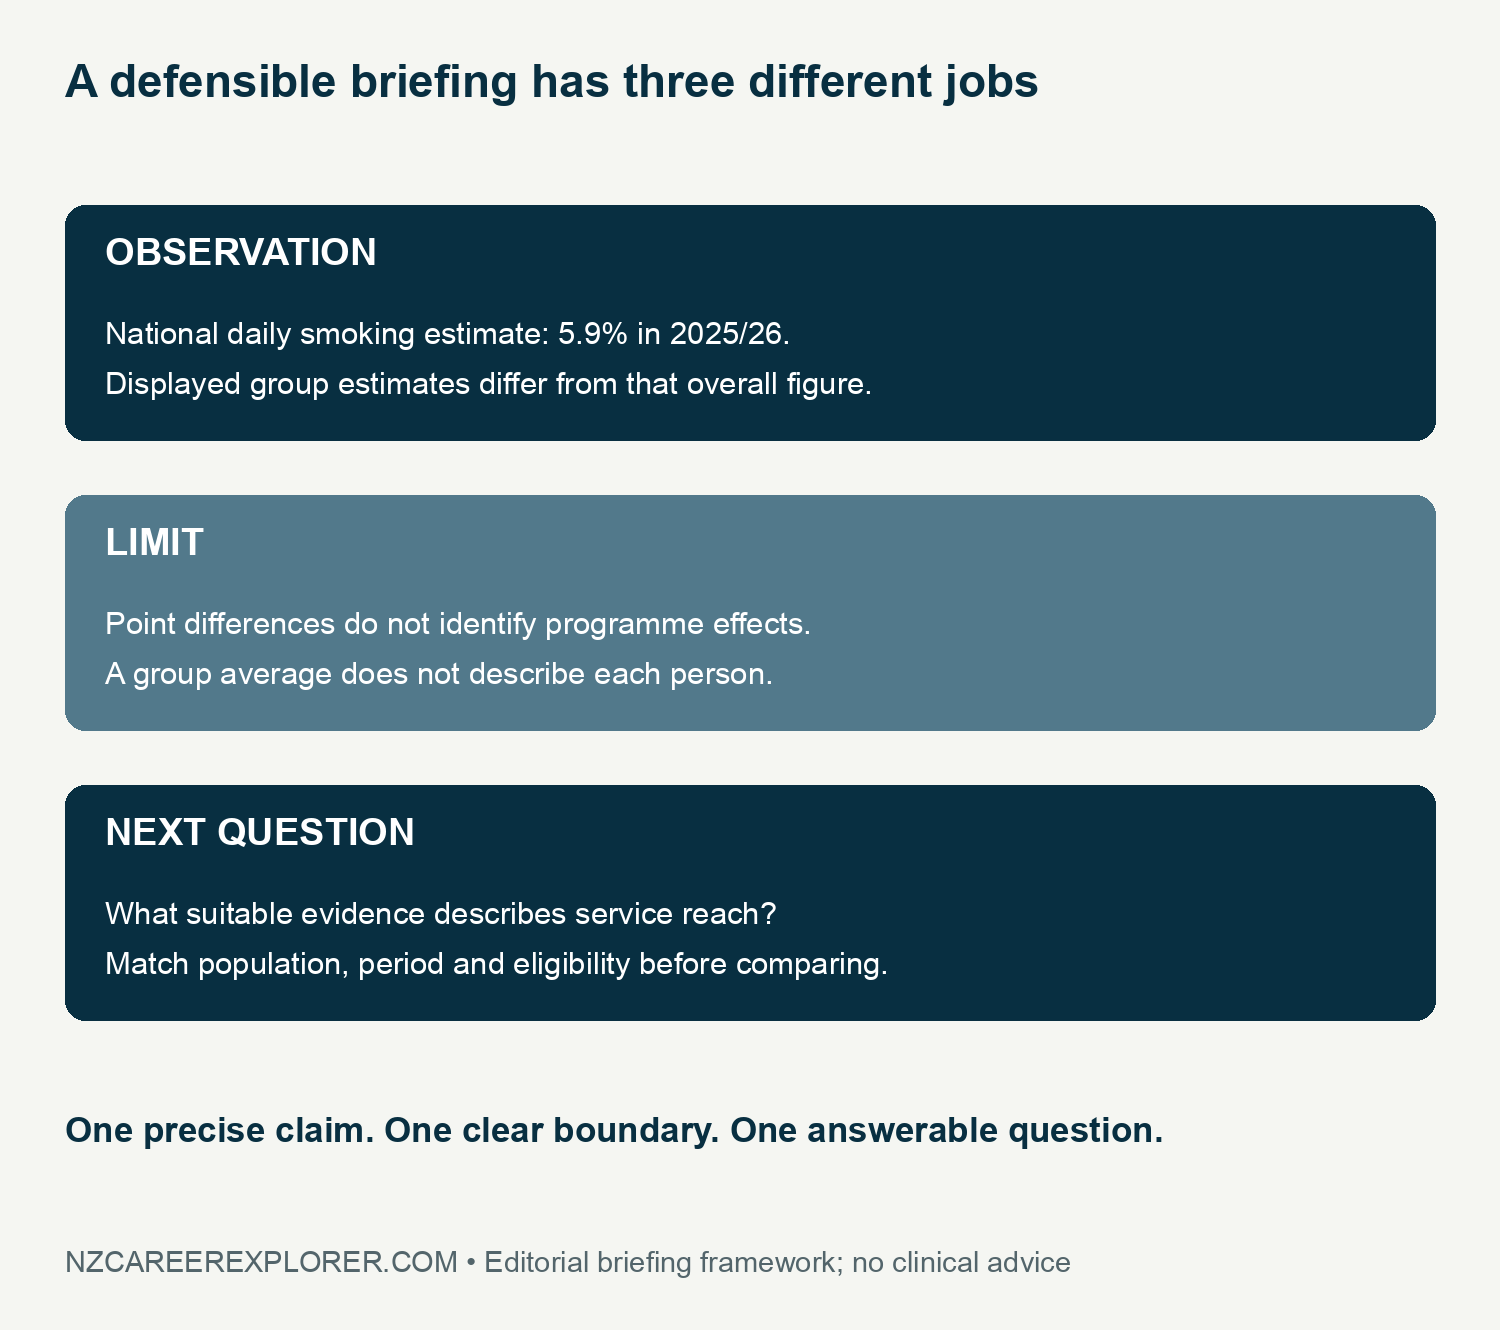
A defensible observation reads: “The Ministry’s 2025/26 daily-smoking estimate is 5.9% nationally; displayed population-group estimates differ, including 13.9% for Māori.” That sentence identifies the measure and period without claiming that everyone in a group has the same behaviour.
Follow it with a limitation: “These descriptive comparisons do not establish a programme effect, an individual’s smoking status or a statistically tested difference in this exercise.” The limitation belongs beside the observation, rather than hidden at the bottom of a slide.
Then ask a useful next question: “What separate evidence shows whether relevant services are reaching the intended population during a comparable period?” Specify the service eligibility and the reach denominator before requesting data. A service-use count and a prevalence rate do not automatically form a valid ratio.
Make the portfolio inspectable without claiming fieldwork
The blank briefing sheet records release date, reference period, indicator, population, observation, calculation, uncertainty and unsupported claims. Add a reviewer field in your own working copy if needed, but do not label the result independently reviewed when no review took place.
An applicant can explain why they retained the long series, separated the group panel and stopped short of attribution. Those choices demonstrate evidence discipline. They do not establish professional registration, clinical competence, employer acceptance or a measured impact on a community.
For broader role context, see our public health careers overview. The contribution here is a reproducible one-page communication task that a tutor can inspect, rather than another career directory.
Personalized Career Consulting
Unlock your potential with expert career advice tailored to your goals. Get personalized guidance and actionable steps toward your dream career in New Zealand.
Get StartedMethod, limitations and downloadable evidence
We downloaded the Ministry’s national chart CSV and checked the displayed group values on 22 November 2026. The source stores national proportions; we multiplied by 100 to express percentages and retained its one-decimal precision and matching intervals. We calculated differences from those published rounded estimates.
The source’s current annual release notes corrections to earlier data. Our retained file and release date identify the version used. No programme evaluation, clinical recommendation, significance test, patient data analysis or hiring-demand estimate is claimed. The group panel deliberately omits intervals rather than borrowing them from a different series.
- National smoking series with published intervals (CSV)
- Displayed group estimates and descriptive calculations (CSV)
- Blank one-page briefing worksheet (CSV)
- Measure, denominator and source checklist (CSV)
Sources: Ministry of Health smoking and vaping report, national chart CSV, annual results notes and methodology, released 18 November 2026. Suggested citation: NZ Career Explorer, “NZ Public Health Analyst: Brief a National Drop Without Hiding the Gaps”, 22 November 2026.


