





A strong NZ data analyst portfolio data correction exercise shows which published claim changes when its source changes. It also leaves a clear audit trail. This worked example revisits two producer-price index observations, reproduces the calculation in each publication version and supplies a small impact log for downstream reports.
On 18 November 2026, Stats NZ published a business-price correction notice. It identified missed customs inputs caused by code and an outdated selection lookup. The September-quarter release says historical corrections cover March 2021 through June 2026. The release date therefore differs from the dates of the observations below.
NZ data analyst portfolio data correction: keep both dates
Start your portfolio file with two separate fields: reference quarter and publication version. The reference quarter tells the reader when the measurement applies. The version tells them which published values you used. A download date can help preserve provenance, but it does not replace either field.
Next, name the exact series and unit. This exercise uses the output index for meat and meat product manufacturing. An index level is neither an employee’s pay nor an individual business’s price list. The exercise demonstrates reporting QA; it does not estimate vacancies, wages or hiring demand.
| Reference quarter | Previously published | Revised |
|---|---|---|
| March 2026 | 1,534 | 1,807 |
| June 2026 | 1,535 | 1,857 |
Compare versions within the same observation period
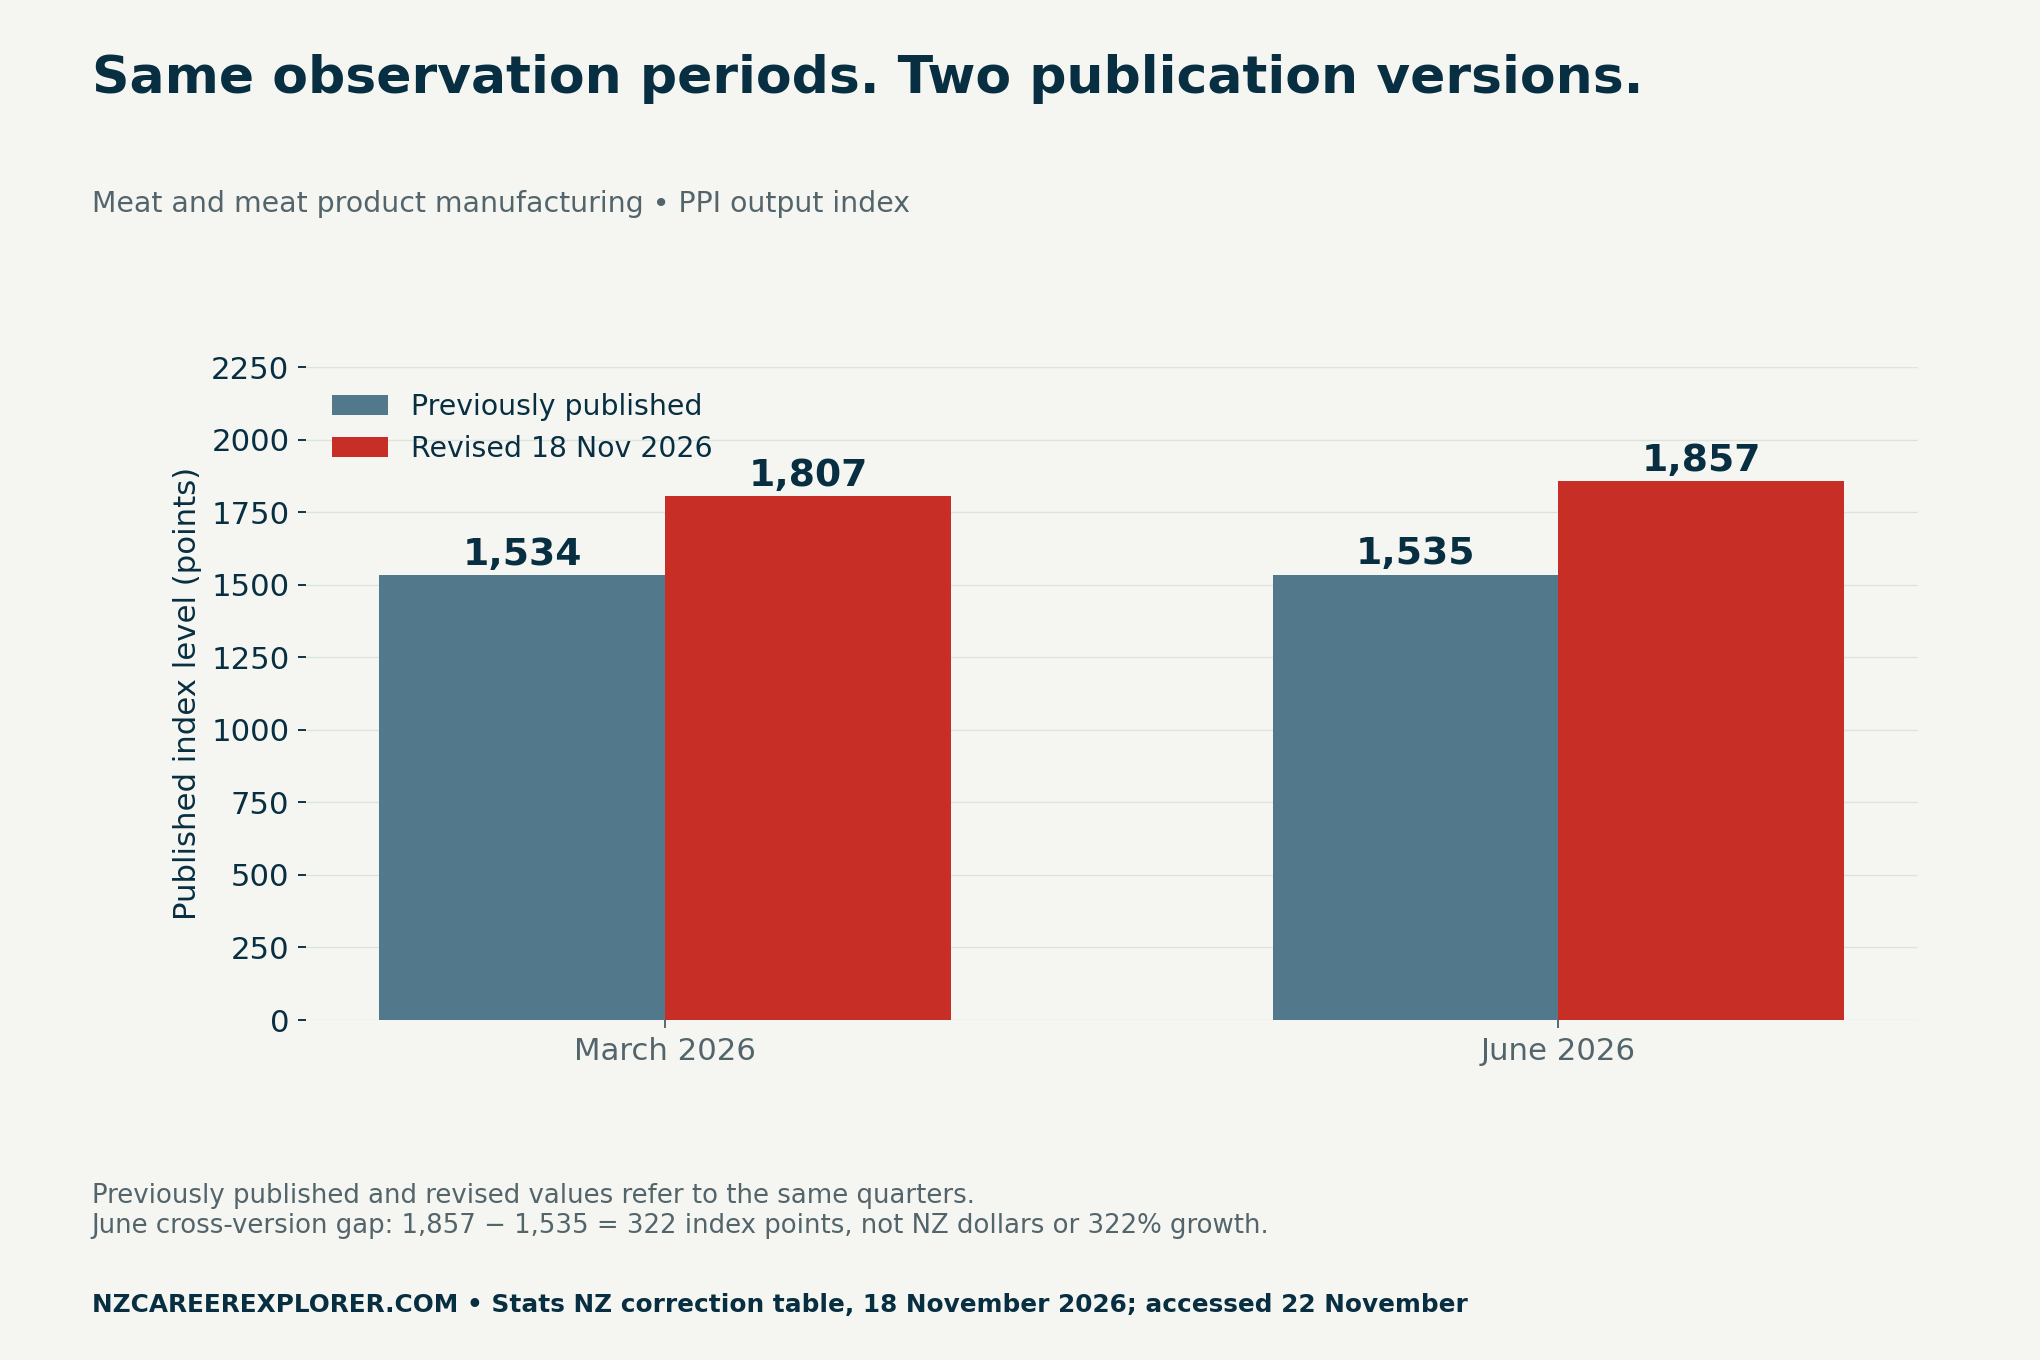
June’s cross-version subtraction is 1,857 − 1,535 = 322 index points. It answers how far the two published levels differ for that quarter. It does not answer how much the index moved from March to June. Keeping the question beside the arithmetic prevents a correct subtraction from becoming an incorrect headline.
For a portfolio reviewer, retain both old and new rows. Overwriting the old values would make it harder to explain why an earlier dashboard sentence changed. Instead, use an explicit version field and keep the source citation alongside each row. That makes the history inspectable without implying either version is a different observation period.
Reproduce growth using one publication version at a time
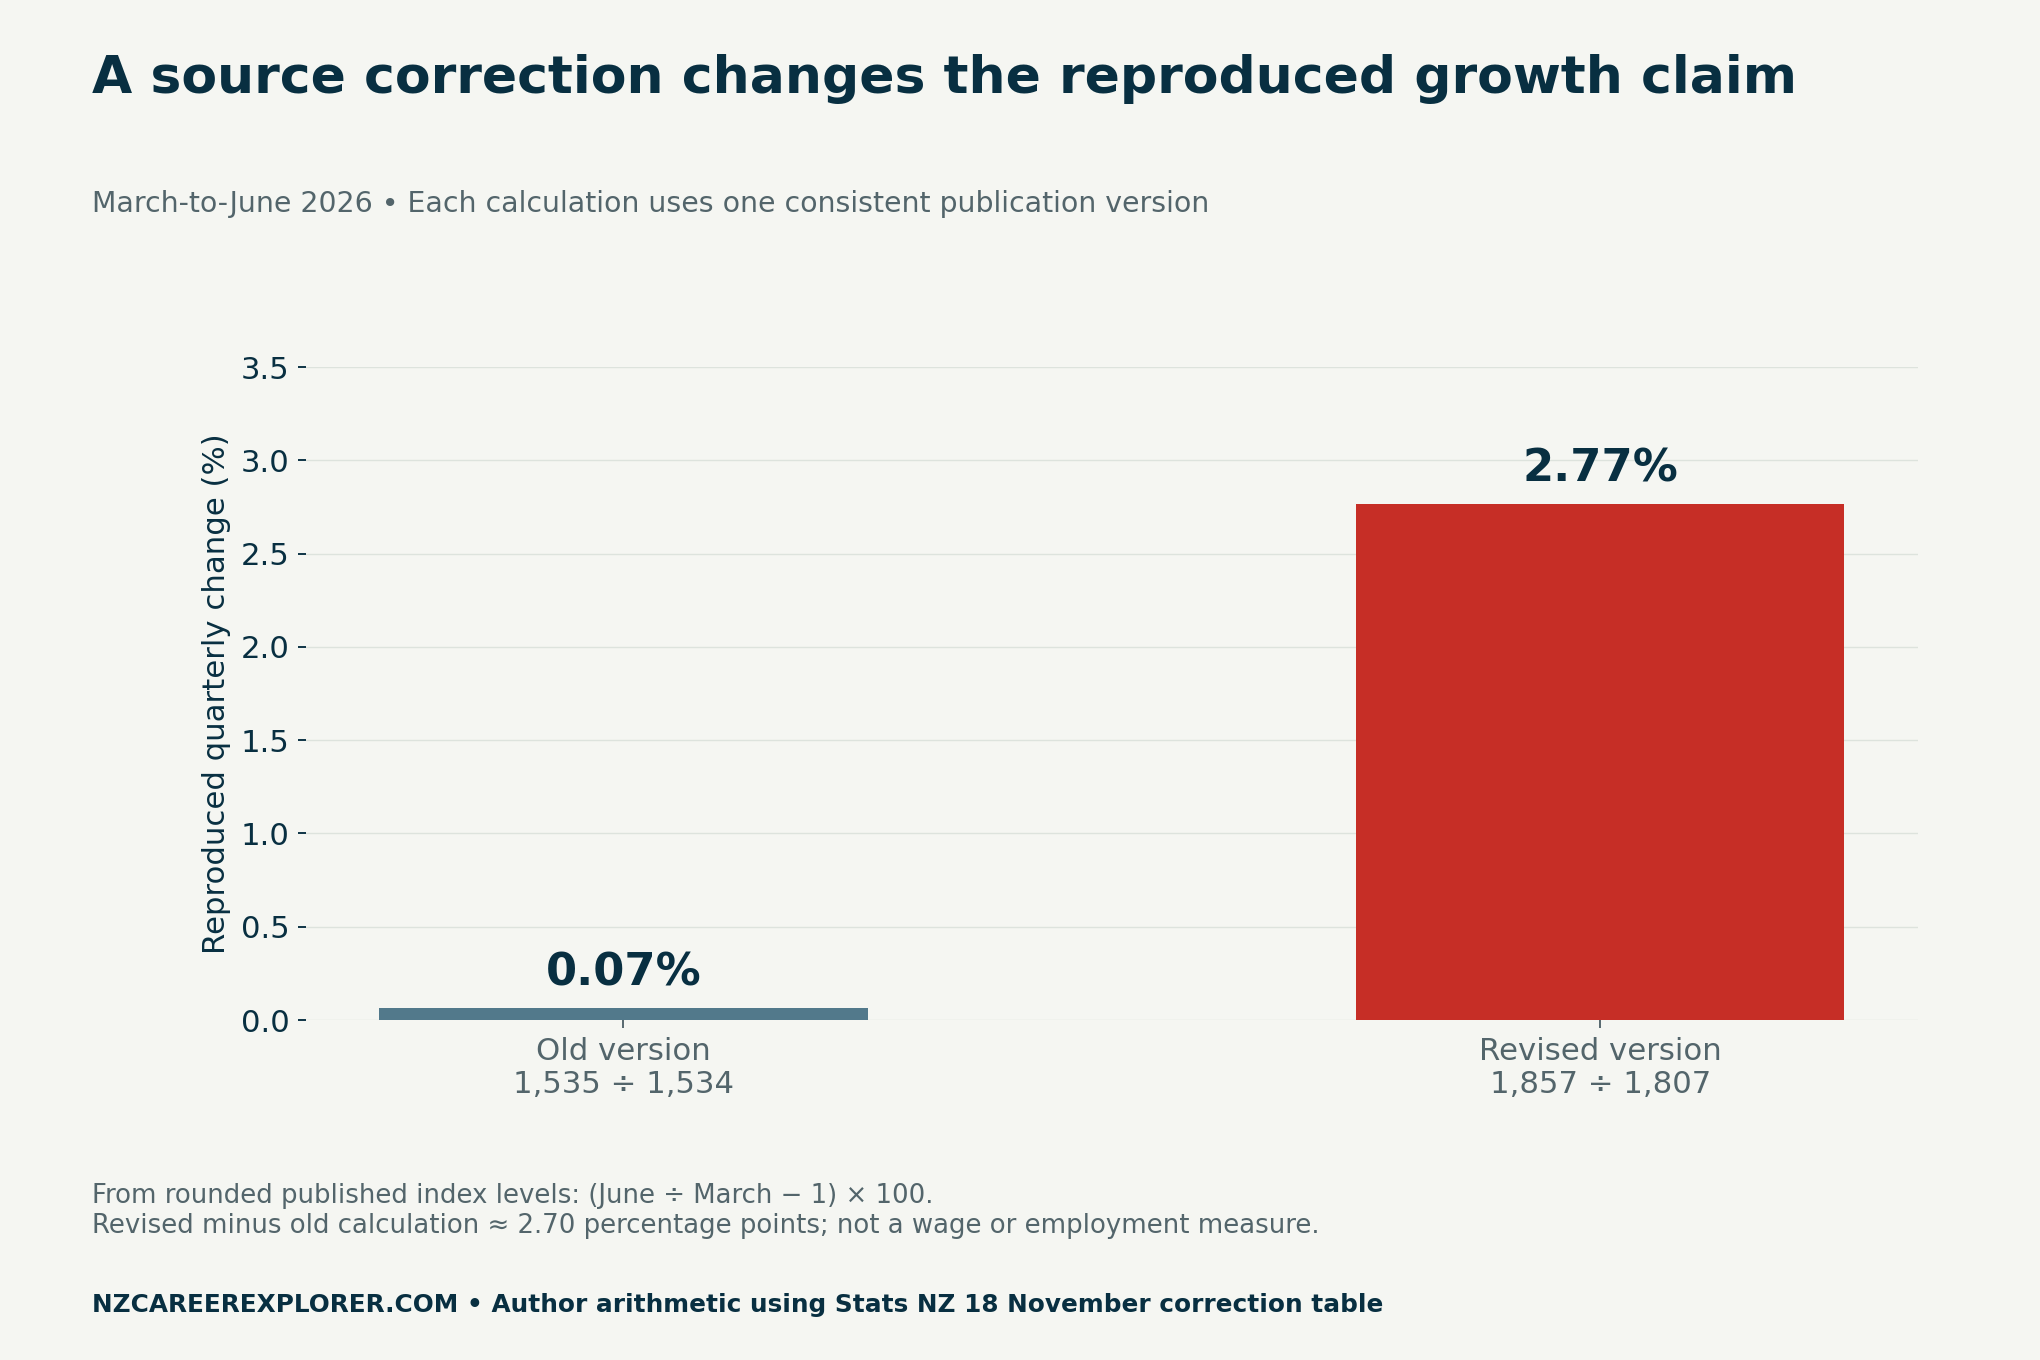
The old-version calculation is (1,535 ÷ 1,534 − 1) × 100 ≈ 0.07%. The revised-version calculation is (1,857 ÷ 1,807 − 1) × 100 ≈ 2.77%. Subtracting the unrounded calculations gives about 2.70 percentage points. Our downloadable calculation file retains the additional decimal places before display rounding.
Notice the denominator change. Dividing revised June by old March would mix publication versions. Its arithmetic might run without an error, yet it would answer neither of the intended quarterly-growth questions. A version test should stop that calculation before it reaches a chart or headline.
Put the version test before the dashboard
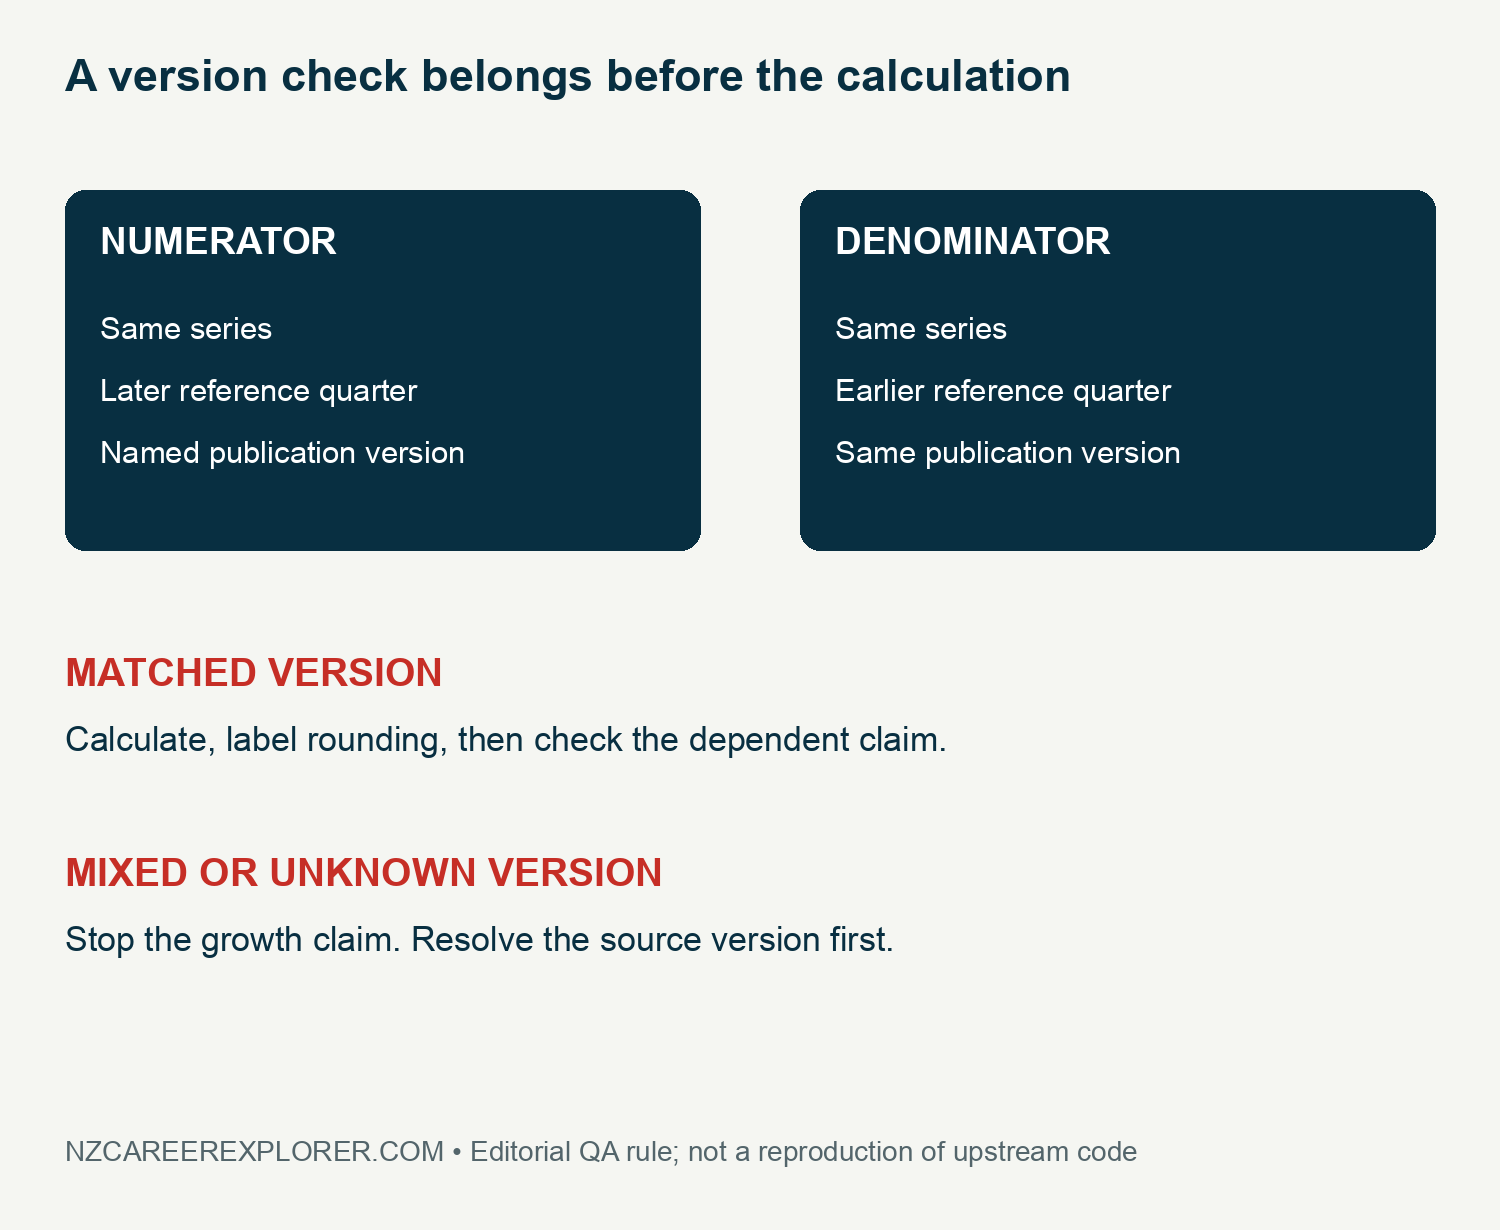
The test file includes accepted old-version and revised-version examples, a rejected mixed-version example and an unknown-version query. Its labels are editorial QA outcomes for this exercise. They are not certifications of a production system. A real pipeline would also test the series identifier, units, reference periods and missing values.
Use a stable identifier for the series, rather than matching only a friendly chart title. Then require an explicit version on both input rows. If the version is missing, leave the result unresolved. Do not fill the gap by assuming the newest file contains every historical series in the same form.
Document what the correction changes downstream
The blank impact log starts with the affected asset or sentence. Add its old and new source version, observation period, units, values and dependencies. For example, a chart could feed a report paragraph, a slide and a social caption. Each dependent claim needs a separate check, even if all three use the same spreadsheet.
Assign an owner and a reviewer field, then record a dated correction note after the check. A blank reviewer cell is an honest pending task. Filling it with a name is not evidence of independent review. Similarly, changing a CSV does not prove that a cached dashboard, exported PDF or scheduled post now uses that file.
A useful portfolio handover explains the scope: which outputs were corrected, which were inspected and which remain unresolved. Keep old exports as evidence when appropriate, rather than silently replacing the history. This makes a reporting correction understandable to someone who did not build the original analysis.
Method, limits and four downloadable files
We transcribed the four displayed levels from the correction table, checked on 22 November 2026, and reproduced the ratios above. The Infoshare change notice identifies affected series with revision flags. For other industries or periods, retrieve their own corrected data instead of extending this two-quarter example.
The portfolio does not reproduce the upstream coding error, access private customs records or measure an individual business. It also makes no wider GDP conclusion from this small calculation. For broader technical-career context, see our NZ data science skills overview; this exercise is about evidence handling, not an employer’s hiring test.
Personalized Career Consulting
Unlock your potential with expert career advice tailored to your goals. Get personalized guidance and actionable steps toward your dream career in New Zealand.
Get Started- Versioned published index levels (CSV)
- Reproduced calculations with unrounded results (CSV)
- Blank downstream correction impact log (CSV)
- Worked publication-version test cases (CSV)
Sources: Stats NZ correction notice and industry table, September 2026 release and Infoshare changes. Suggested citation: NZ Career Explorer, “NZ Data Analyst Portfolio: Show What a Source Correction Changes”, 22 November 2026.


