





Comparing small vs large employers NZ options starts with a denominator check. New Zealand has many enterprises without paid employees. Yet a relatively small group of large employers accounts for about half the employees in the business-demography snapshot. A business count and an employee share can both be correct while telling very different stories.
For a jobseeker, neither measure tells you where a suitable vacancy is open today. This report explains the latest figures, provides five branded charts and offers a blank employer-shortlist worksheet. Use the national structure to broaden your research, then verify the actual role, location and terms.
What the February 2026 business snapshot covers
Stats NZ released its February 2026 business-demography statistics on 30 October. The provisional snapshot covers economically significant enterprises producing goods and services in New Zealand. It describes February, not the number of vacancies available in November.
The release’s key facts report 620,150 enterprises. It separately reports 161,560 enterprises with at least one paid employee. An enterprise is not necessarily one workplace; a business can operate across several locations. Equally, a business without paid employees may still involve an owner’s work or purchased services.
| Measure | February 2026 figure | Denominator or meaning |
|---|---|---|
| All enterprises | 620,150 | Rounded release key-facts count |
| Employing enterprises | 161,560 | At least one paid employee |
| Enterprises with 100+ employees | 2,810 | Large-enterprise definition in this release |
| Employees at large enterprises | 1,204,500 | People counted in the snapshot, not open roles |
| Large enterprises’ employee share | 49% | Published rounded share of employees in the release’s coverage |
The source’s graph table displays 620,148 for total enterprises, while its key facts round to 620,150. We use the rounded release figure consistently for the approximate ratios below. That difference does not change either ratio at two decimal places.
Small vs large employers NZ: two views of concentration
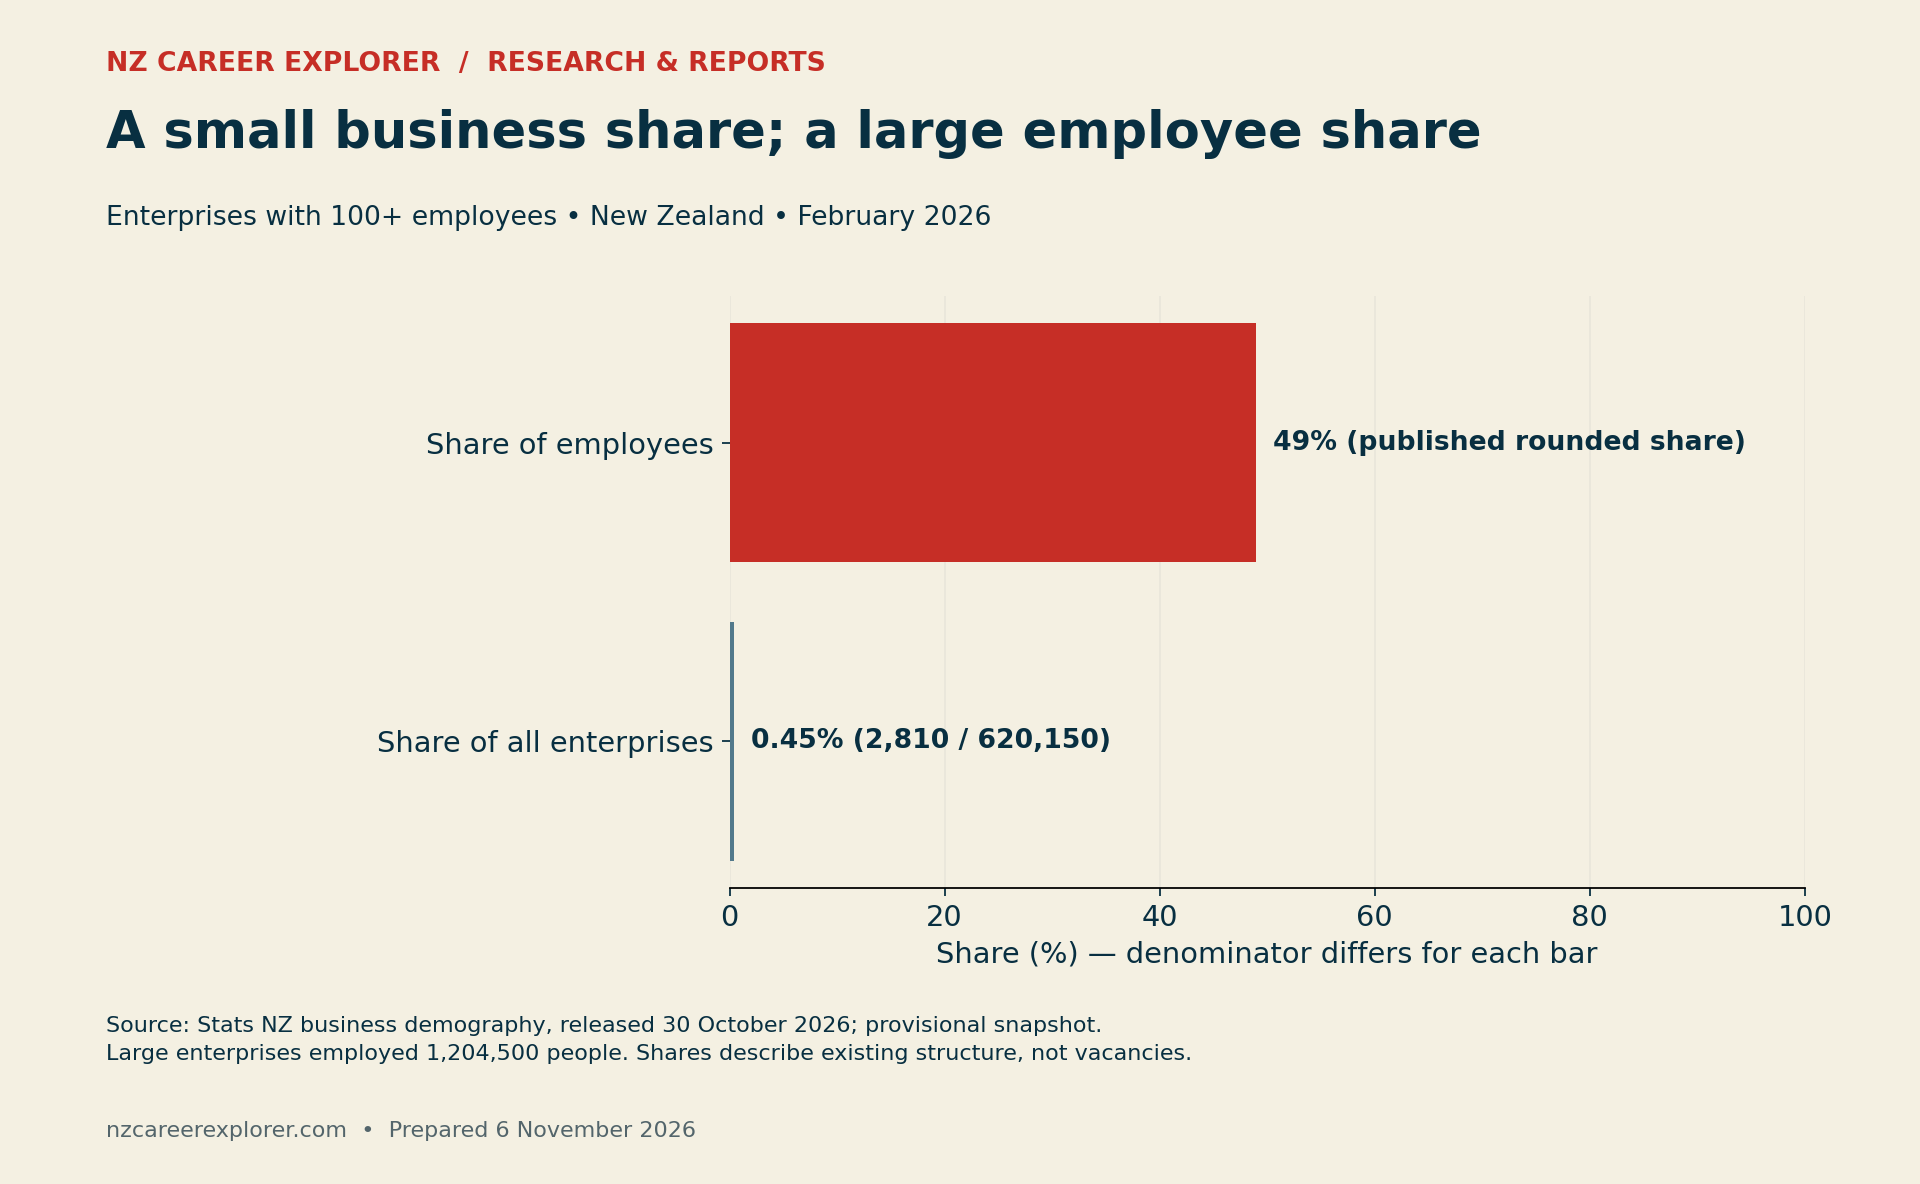
The 2,810 large enterprises represent approximately 0.45% of all enterprises: 2,810 divided by 620,150, multiplied by 100. However, those enterprises account for a published rounded 49% of employees. These percentages have different denominators. They do not mean that 0.45% of employers offer 49% of current vacancies.
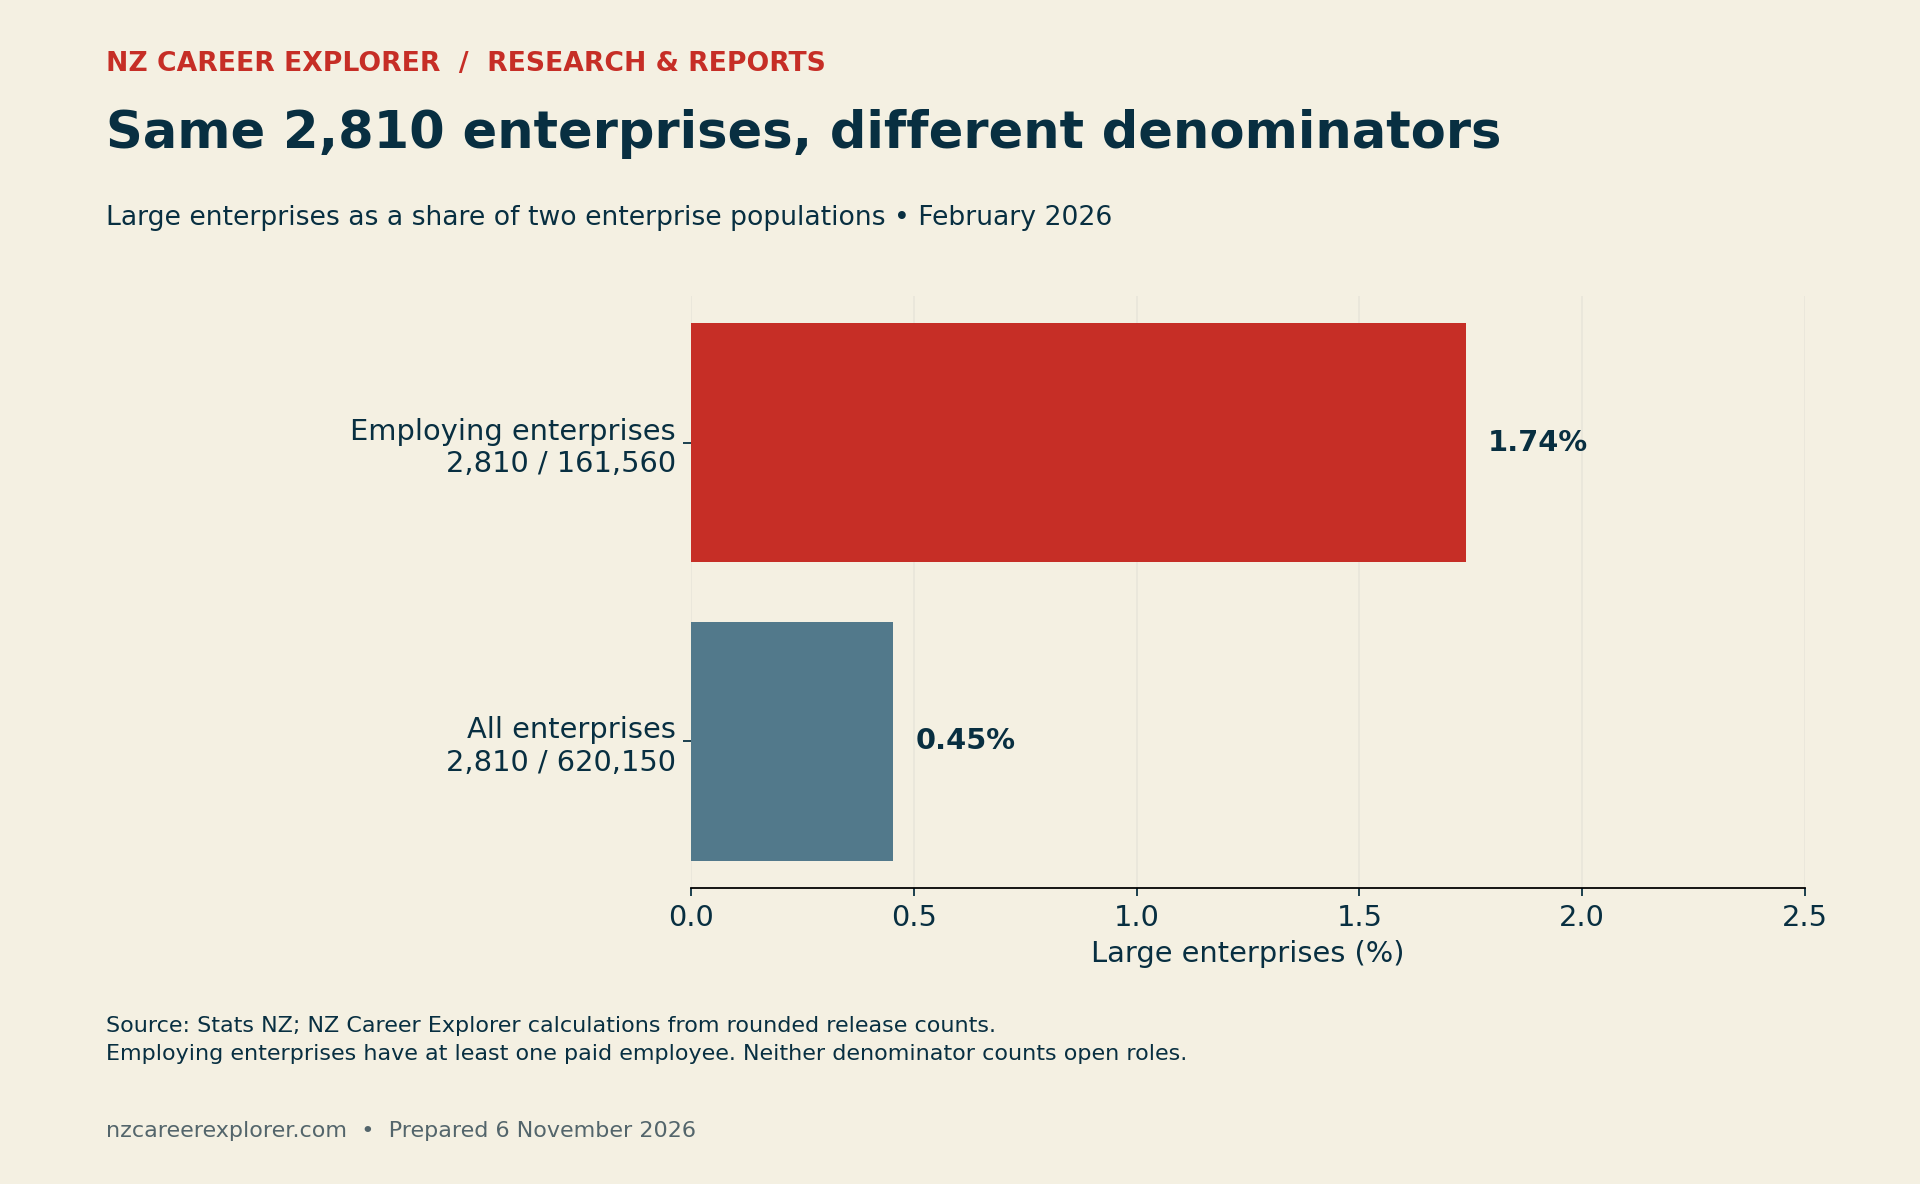
If the question instead concerns employing enterprises, divide 2,810 by 161,560. The result is approximately 1.74%. The numerator stays the same, but the denominator excludes enterprises without paid employees. That is why a statement about “businesses” needs a definition before it becomes useful.
For your shortlist, keep both smaller and larger employers in view where they match your occupation. A small enterprise can have a suitable opening. A large enterprise can have none near you. The national concentration is a reason to investigate, not a ranking of employers worth applying to.
Why the non-employer share needs care
The release says 74% of enterprises had no paid employees. The chart below uses 26% as the complement of that rounded share. It does not estimate an exact non-employer count by multiplying a rounded percentage and then presenting the result as an official total.
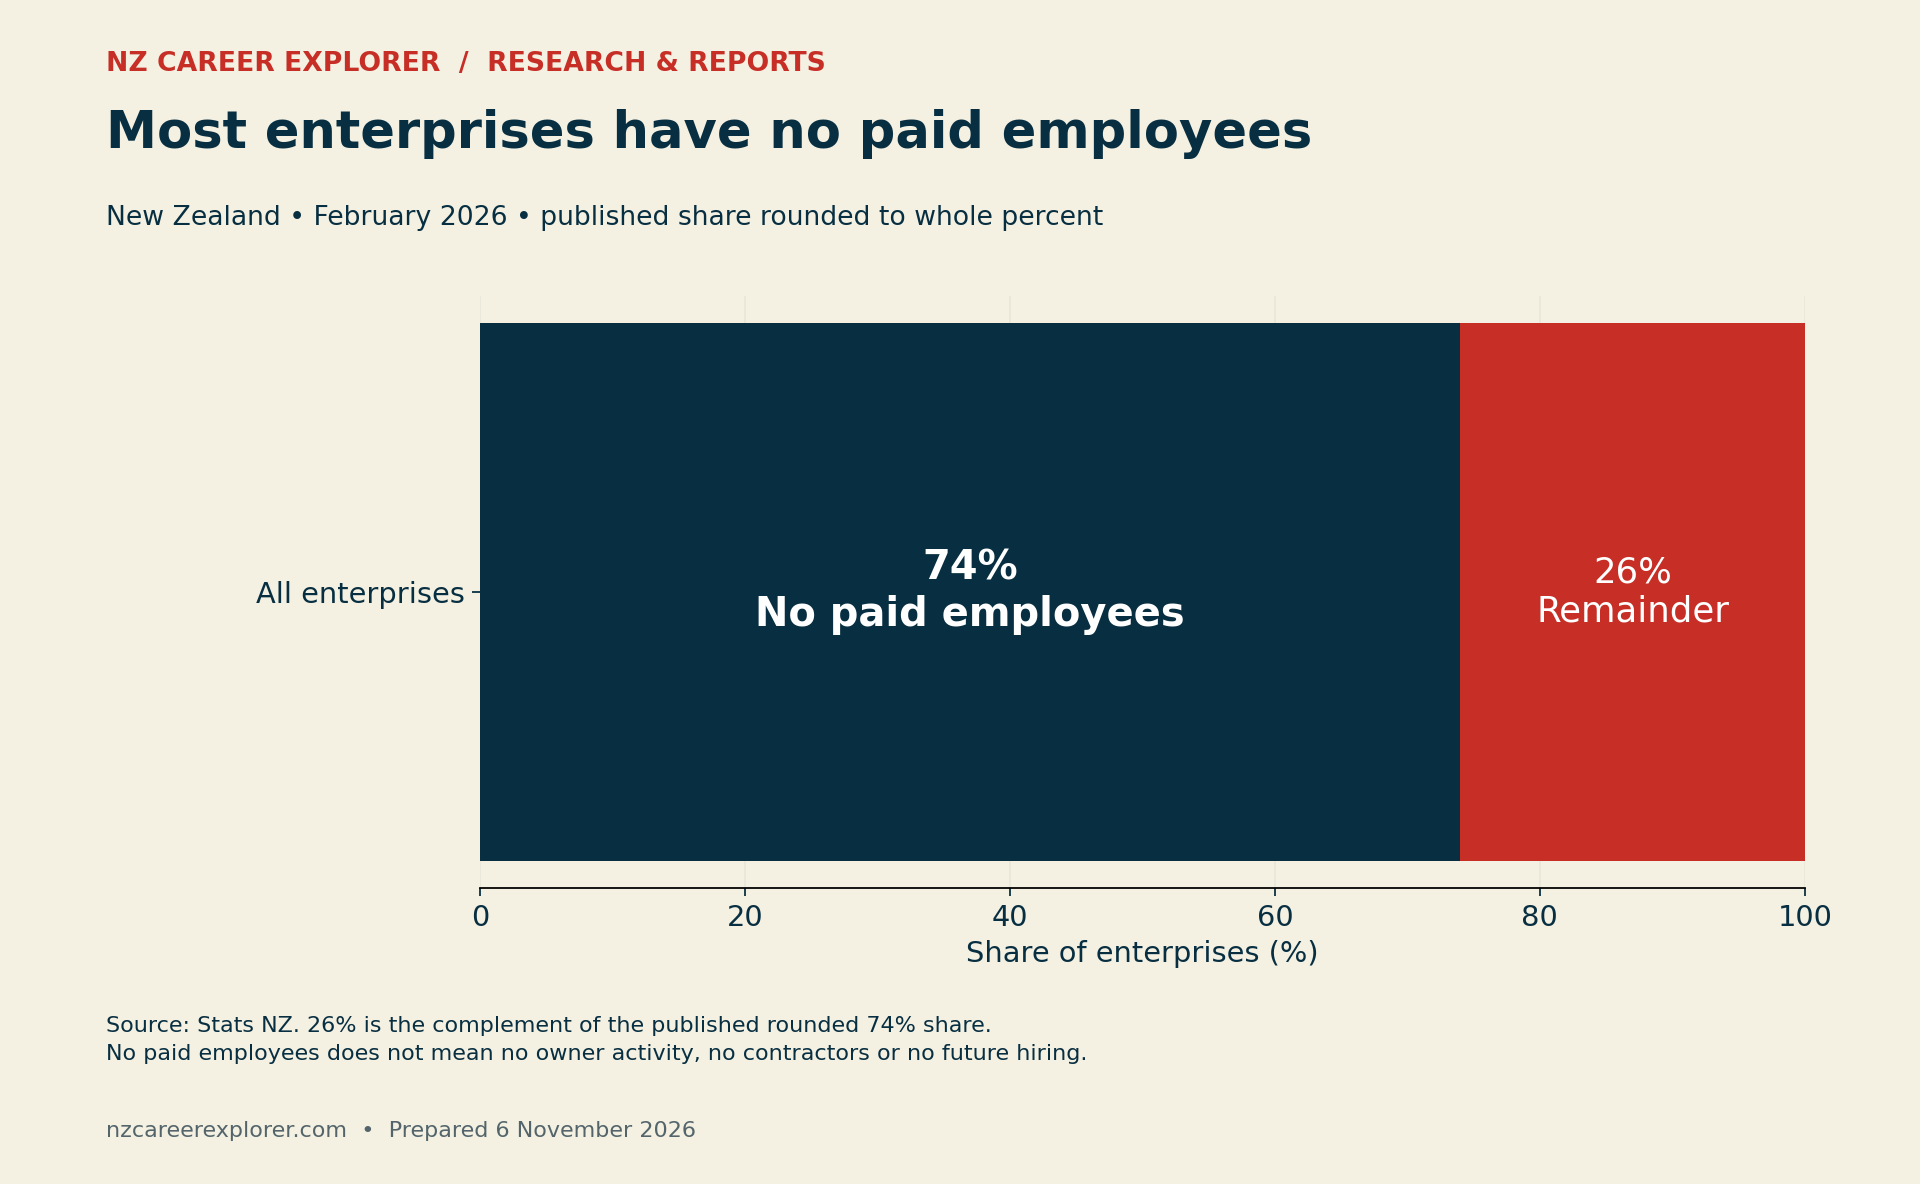
Avoid assuming that a long directory of businesses is a long list of potential salaried jobs. Before spending time on a speculative application, establish whether the organisation employs people in your occupation and whether it has an appropriate recruitment route. Keep an unanswered question as unknown rather than inventing a size estimate.
Similarly, employee numbers are not a quality score. They do not establish pay, flexibility, management, culture, training or job security. Those matters require role-level evidence and questions you can ask during the recruitment process.
Counts can move in different directions
The size-group chart shows annual changes in enterprise and employee counts between February 2025 and February 2026. For example, the 50–99 employee group increased on both measures, while the 100+ group declined on both. These are historical category-level changes. They do not show which specific employers are recruiting now.
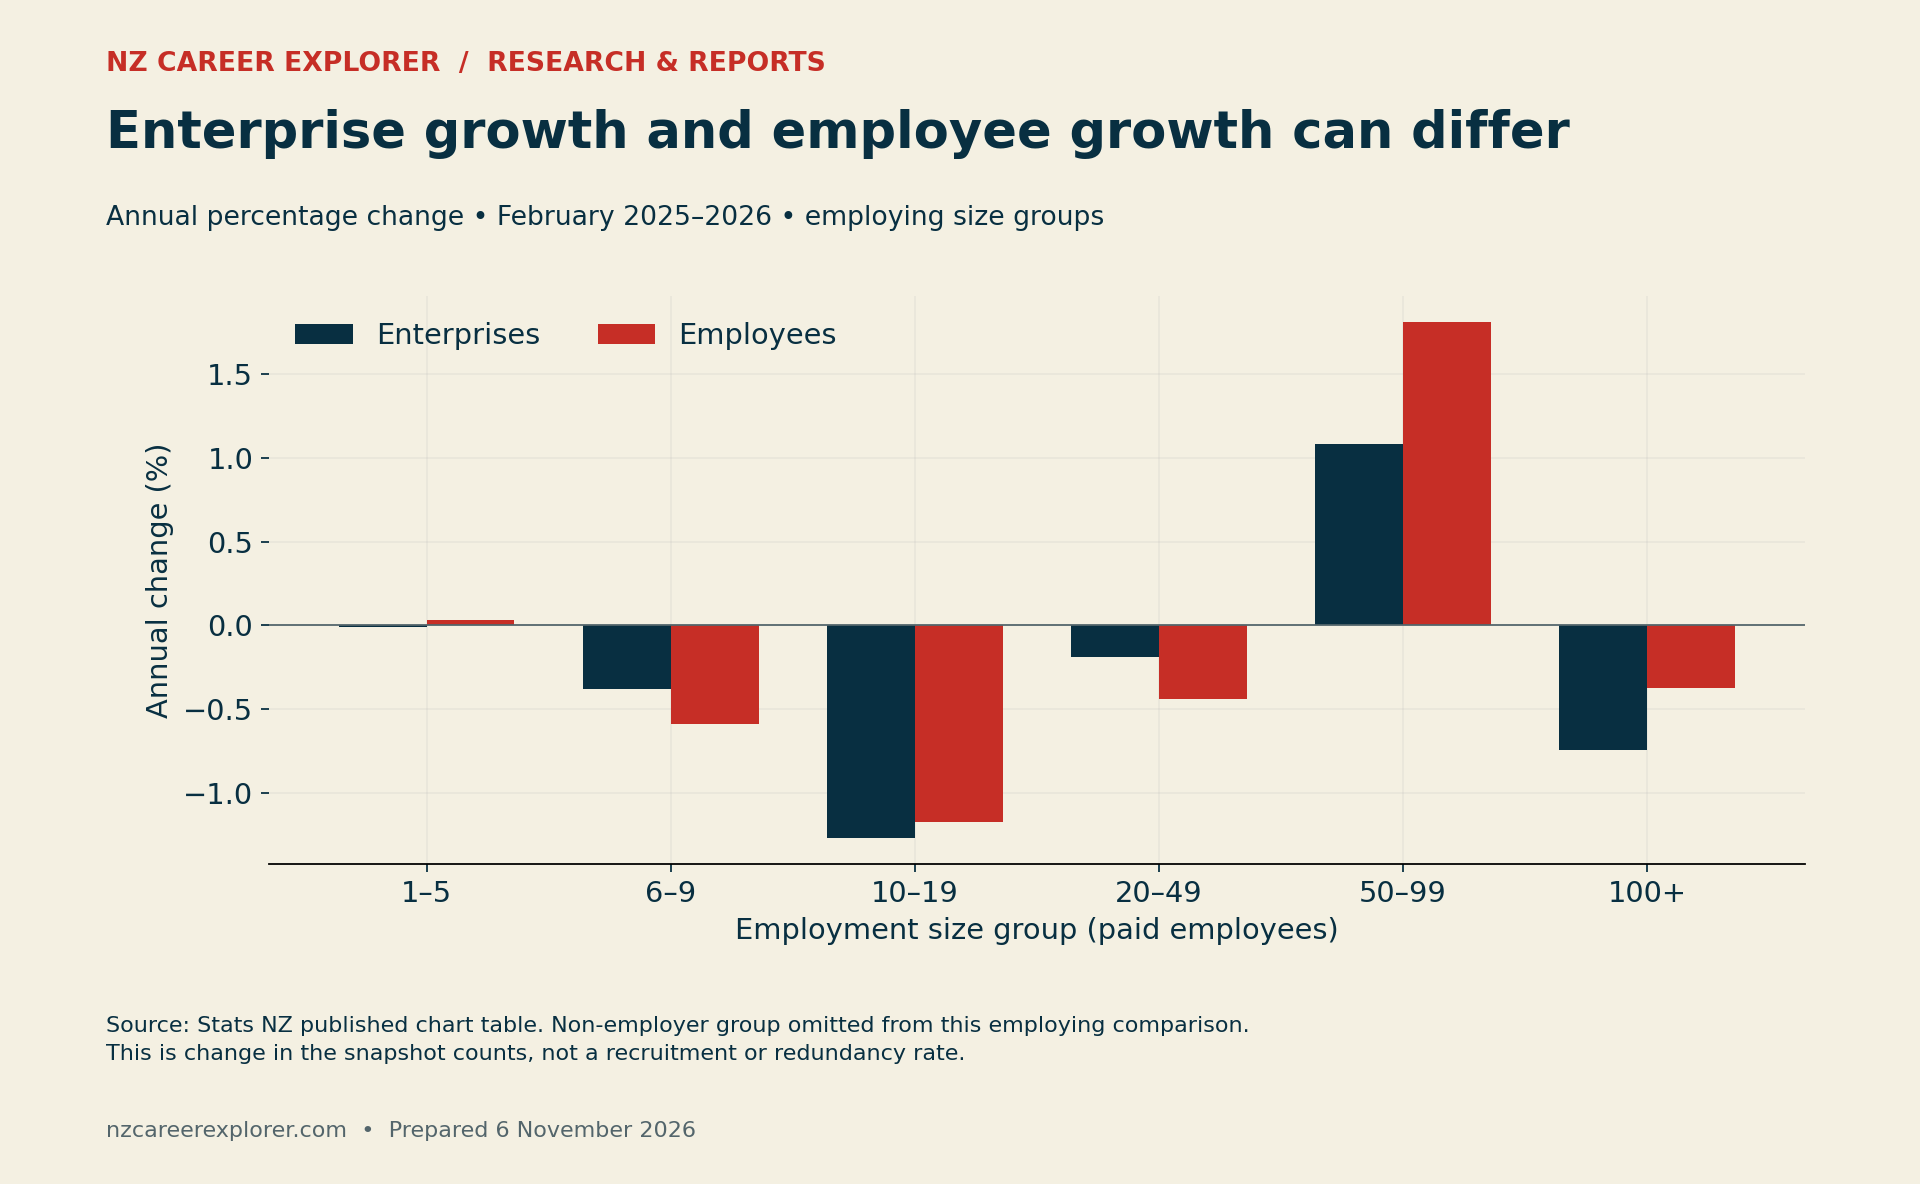
A growing size group does not prove that every enterprise within it expanded. Nor does a declining group make an individual vacancy unsuitable. Businesses can change size, enter or leave the statistics’ coverage, open or close, and reorganise. Read the source methodology before attributing a movement to one cause.
For a different view of recent employment activity, our September filled-jobs report examines an administrative series. It uses another reference period and measure. Keep the two sources separate rather than treating them as interchangeable vacancy totals.
National structure does not replace local research
The regional chart includes all sixteen regions. It shows annual percentage changes in employee counts in the February business-demography snapshot. Local patterns differ, but the figures still do not identify a current opening in your preferred occupation or commuting area.
Personalized Career Consulting
Unlock your potential with expert career advice tailored to your goals. Get personalized guidance and actionable steps toward your dream career in New Zealand.
Get Started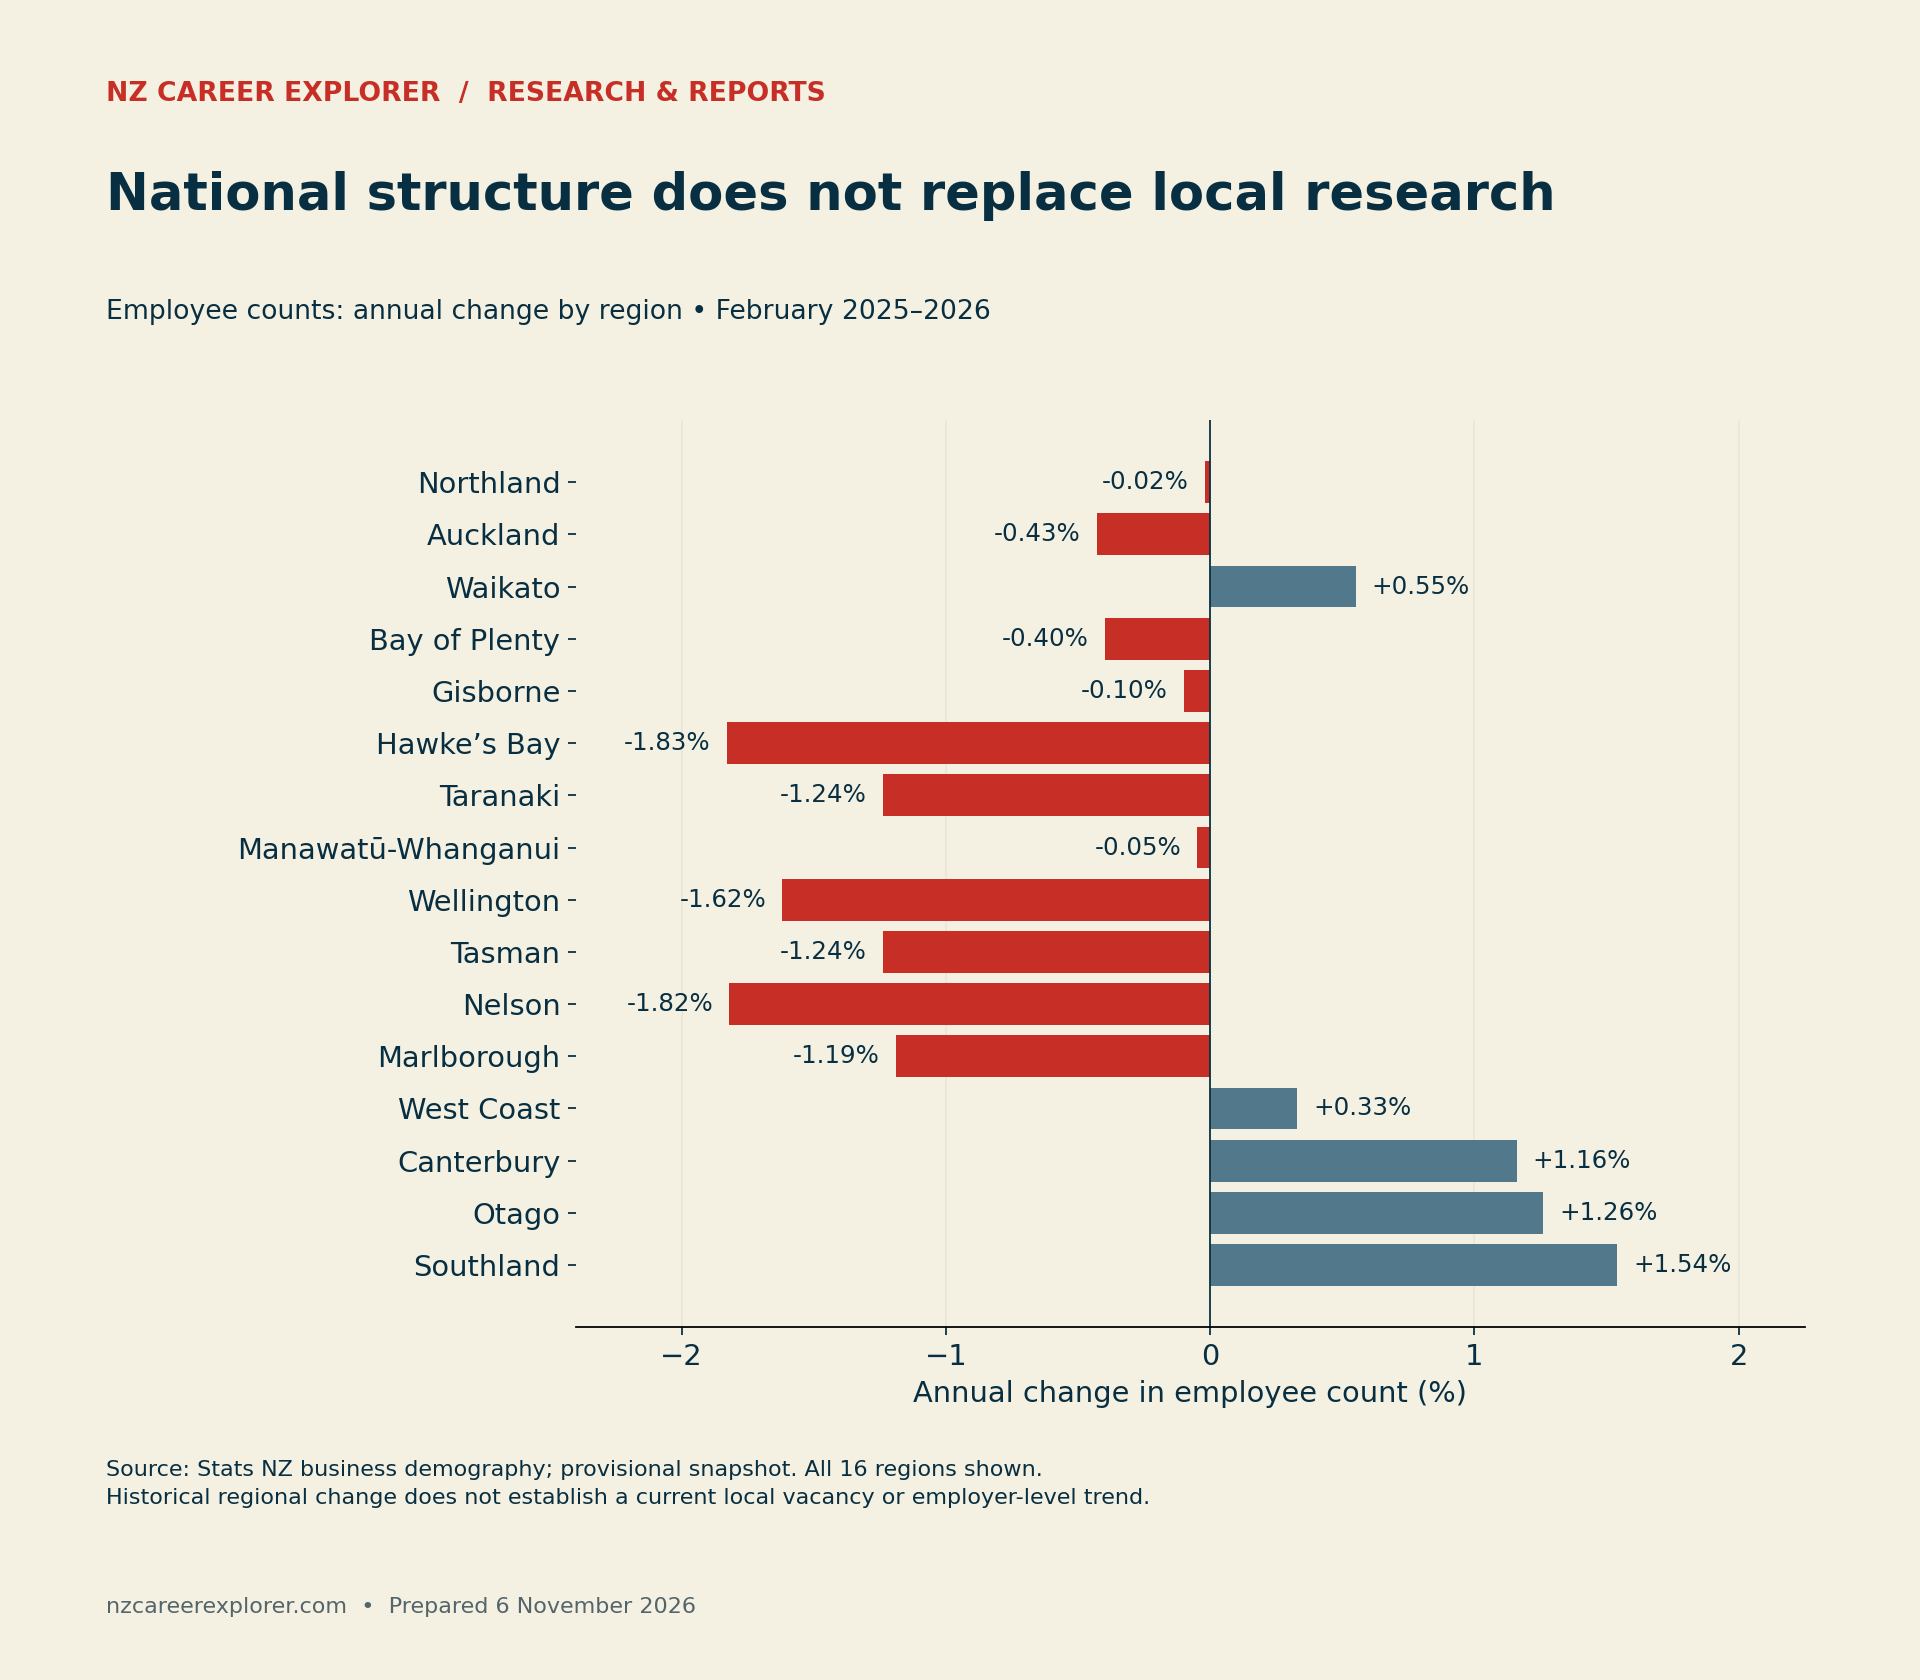
When comparing locations, check transport, work hours, housing and any caring or accessibility needs. A role outside your practical travel range is not an equivalent option merely because its region had employee growth. Record constraints honestly so that the shortlist remains useful.
For relevant newcomers, employer size also does not determine your work rights, occupational registration or the conditions of a visa. Use Immigration New Zealand’s official finding-work guidance to identify the checks that apply to you. Verify any employer-specific claim against the relevant official record.
Build an employer shortlist from live evidence
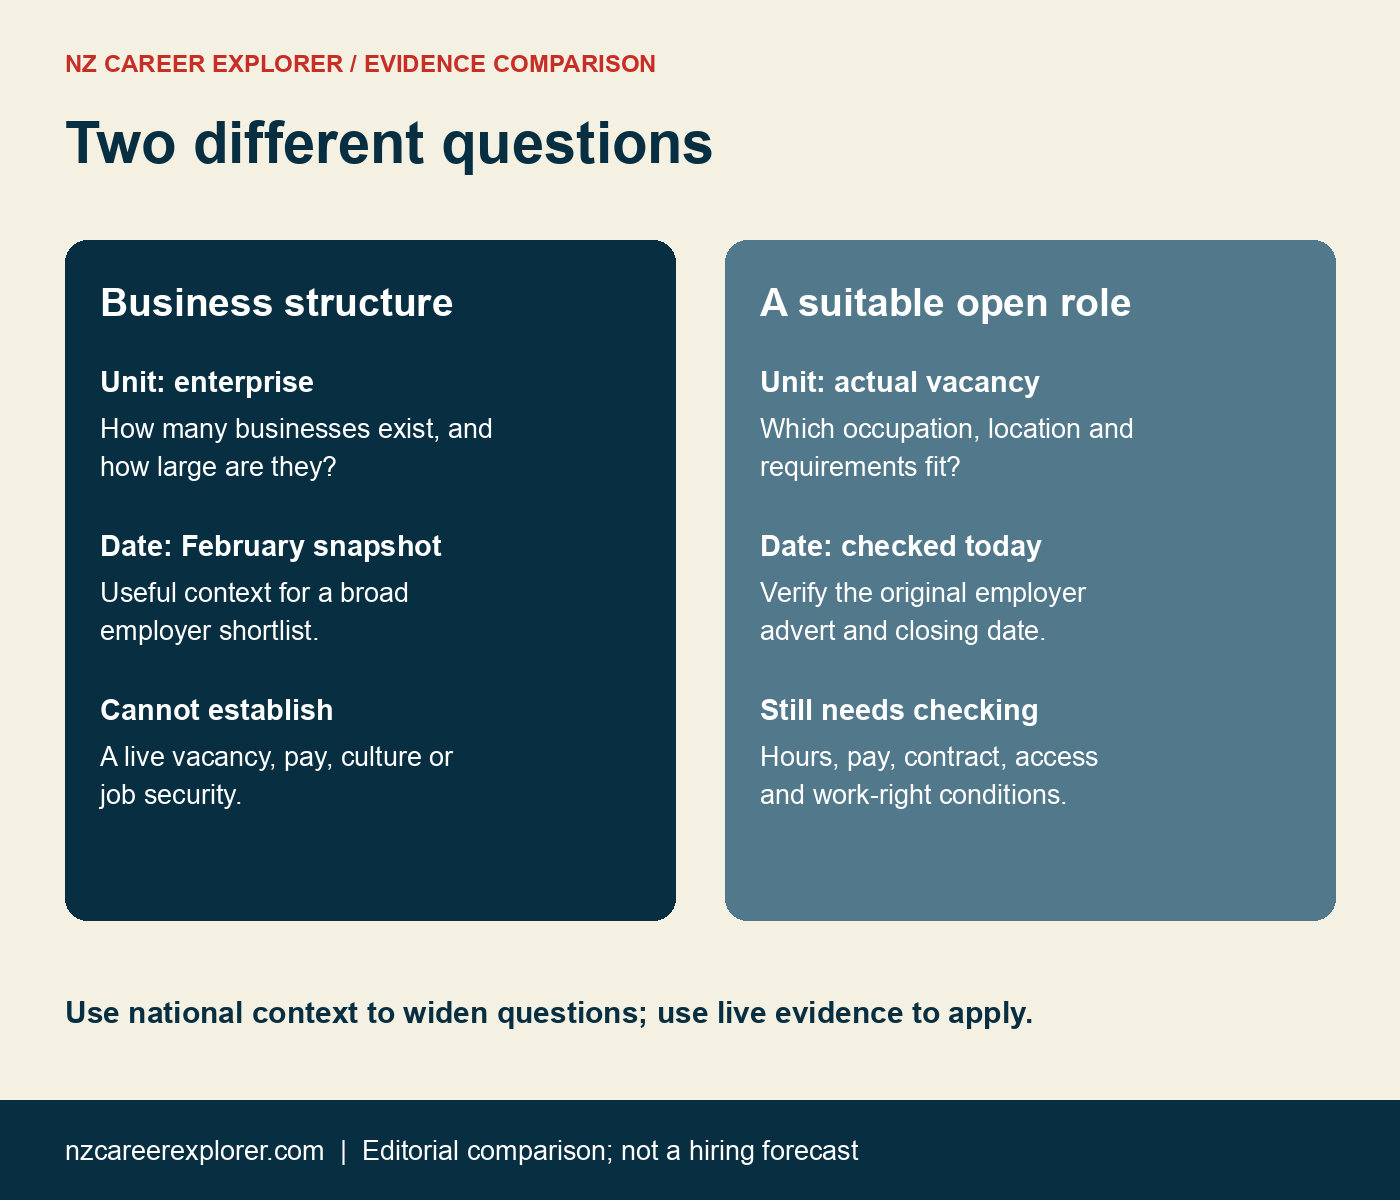
The comparison infographic separates the national question from the application decision. Business structure tells you how the economy is organised. A live advertisement tells you something about a specific role, at a specific time, subject to the information actually supplied.
Start the worksheet with an employer’s original website or recruitment page. Record an occupation match and location before researching size. If a reliable size statement is unavailable, write “unknown”. Do not infer a headcount from a building photograph, social following or brand recognition.
Next, save the original vacancy URL, check date and closing date. Record the essential requirements, stated pay and hours where available. Missing information stays missing. An advertisement that has closed can remain in your research history, but should not be listed as a verified open opportunity.
Finally, choose a next question. You may need to confirm whether a role is based at a particular workplace, whether a qualification is essential, or which hours the employer expects. Ask through the advertised recruitment route. This worksheet does not authorise unsolicited bulk outreach or require you to collect personal contact details.
If you are also reviewing an extended search, our long-term unemployment NZ guide helps separate application stages and pending decisions. Employer research and application review complement each other without proving why an employer made a particular decision.
Download the figures and shortlist tools
The source-data CSV records the counts, denominators, derived shares, size-group changes and all sixteen regional changes. The blank shortlist has twenty entry IDs. You can use fewer or add more; twenty is a convenient template size rather than a recommended application target.
Download the employer-size figures and calculations (CSV)
Get the blank employer-shortlist worksheet (CSV)
Read the shortlist definitions and cautions (CSV)
Keep the completed worksheet private when it contains correspondence or other non-public information. Recheck live vacancy status before applying, even if you verified the same link earlier. A dated shortlist remains more useful than an undated list of supposedly promising employers.
Methodology and limits
We checked Stats NZ’s release on 6 November 2026. The two derived large-enterprise ratios use the release’s rounded counts. The 26% remainder is calculated from the published rounded 74% share. The 49% employee share is reproduced as published; we do not substitute an apparently more precise share from rounded totals.
The statistics are provisional and cover economically significant enterprises. Changes in coverage can affect counts alongside business births, deaths and size changes. The release cautions that its employee count is not an official employment statistic. It is not a current vacancy survey, employer-quality assessment or forecast of individual job prospects.
Transform Your Career with a Professional CV and Cover Letter
Stand out to employers with an ATS-optimized resume and tailored cover letter designed to match your dream role. Let us craft your job application materials for success!
Get StartedSuggested citation: NZ Career Explorer, “Small or Large Employers in NZ? What Business Counts Hide,” prepared 6 November 2026, using Stats NZ, New Zealand business demography statistics: At February 2026, released 30 October 2026. Cite Stats NZ for the source figures and this article for the denominator comparisons and worksheet design.


