





Considering seasonal accommodation jobs NZ employers advertise? Check destination demand, then check the hours in the actual offer. A higher occupancy rate can sound promising. Yet it does not establish that more guests arrived, that staff worked longer or that you will receive extra shifts.
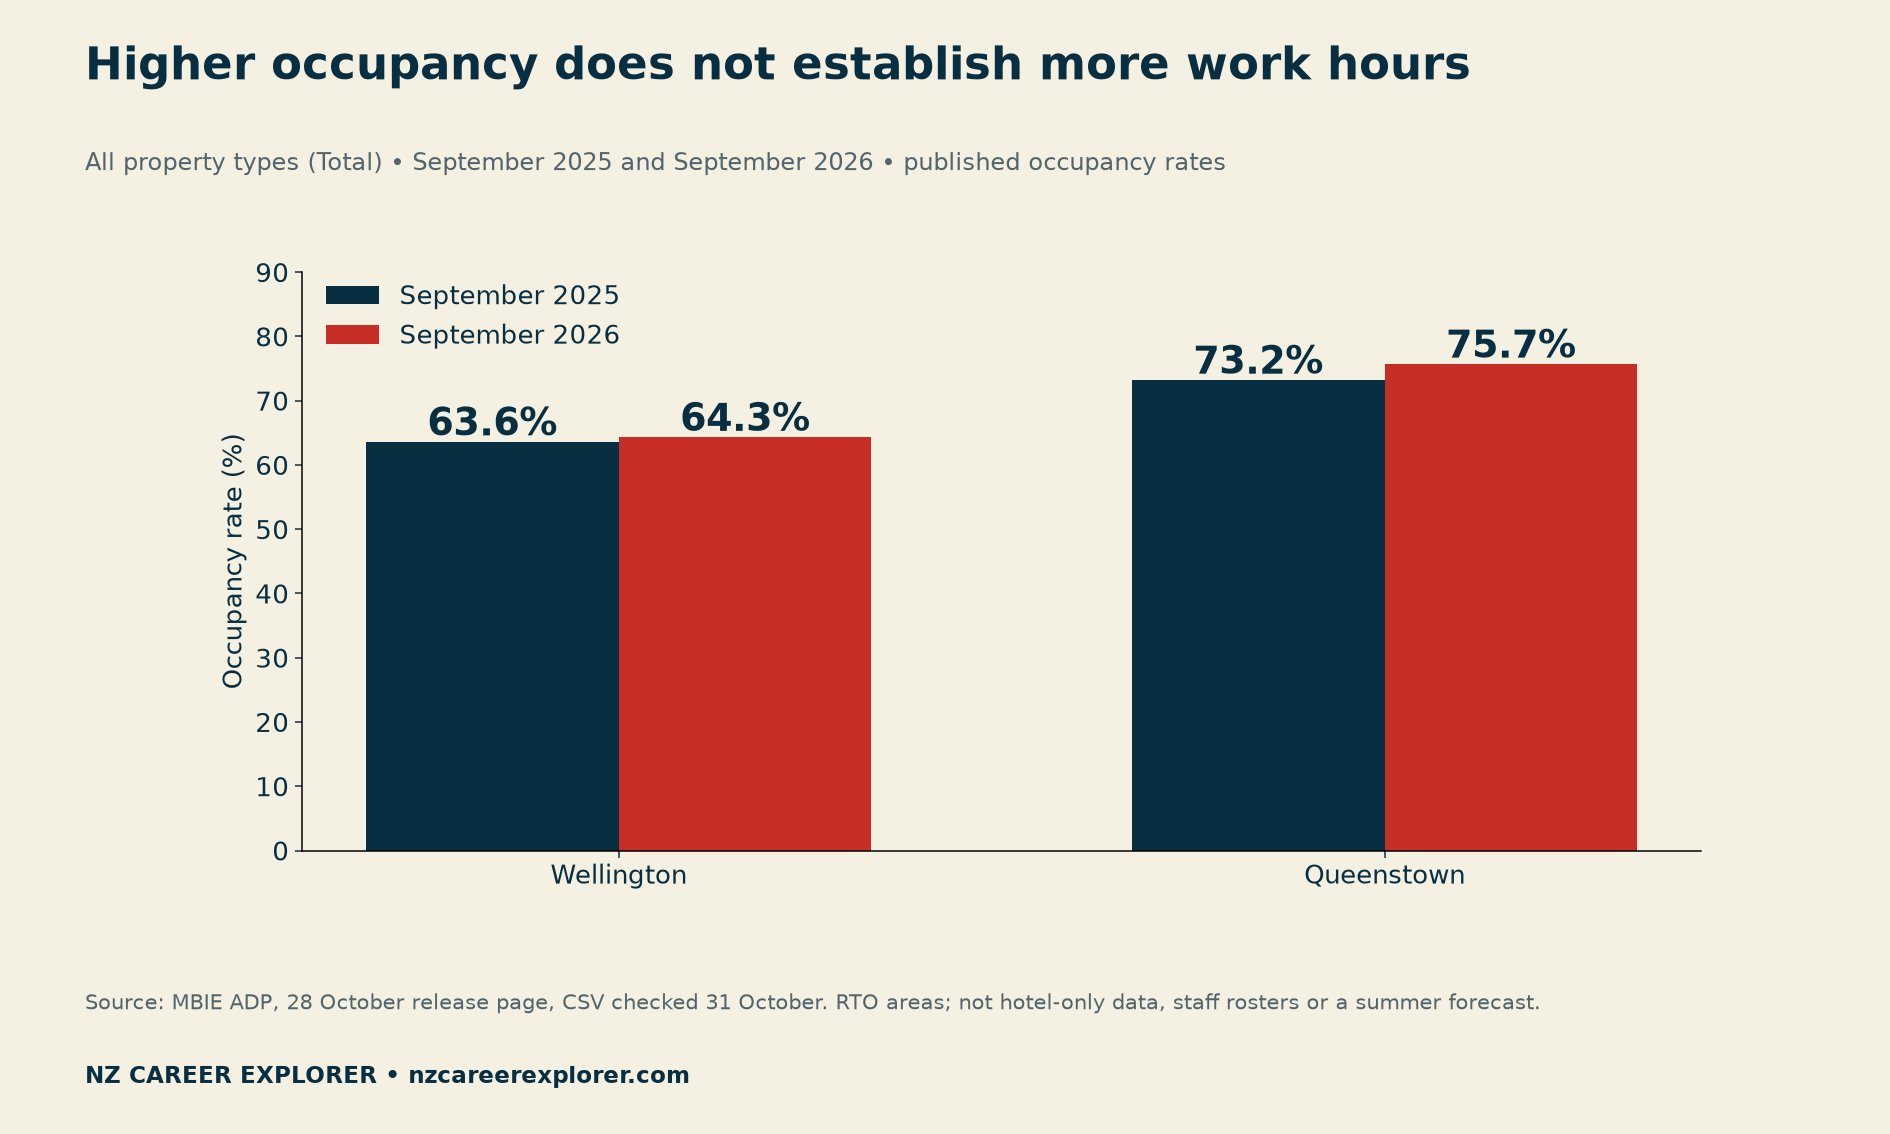
Wellington provides a useful example. Between September 2025 and September 2026, its all-property occupancy rate rose from 63.6% to 64.3%. At the same time, guest nights fell from 220,000 to 214,600. Available accommodation capacity also fell. The denominator matters.
This report compares Wellington and Queenstown using one official Accommodation Data Programme CSV version. Five figures explain the demand measures. Four downloadable tools help you separate market context, written hours and reader-entered budget scenarios before accepting a role or moving.
Checked 31 October 2026. MBIE’s release page is dated 28 October. These are September accommodation estimates, not a summer forecast, wage survey, vacancy count or employee-hours dataset.
Seasonal accommodation jobs in NZ: read the demand figures
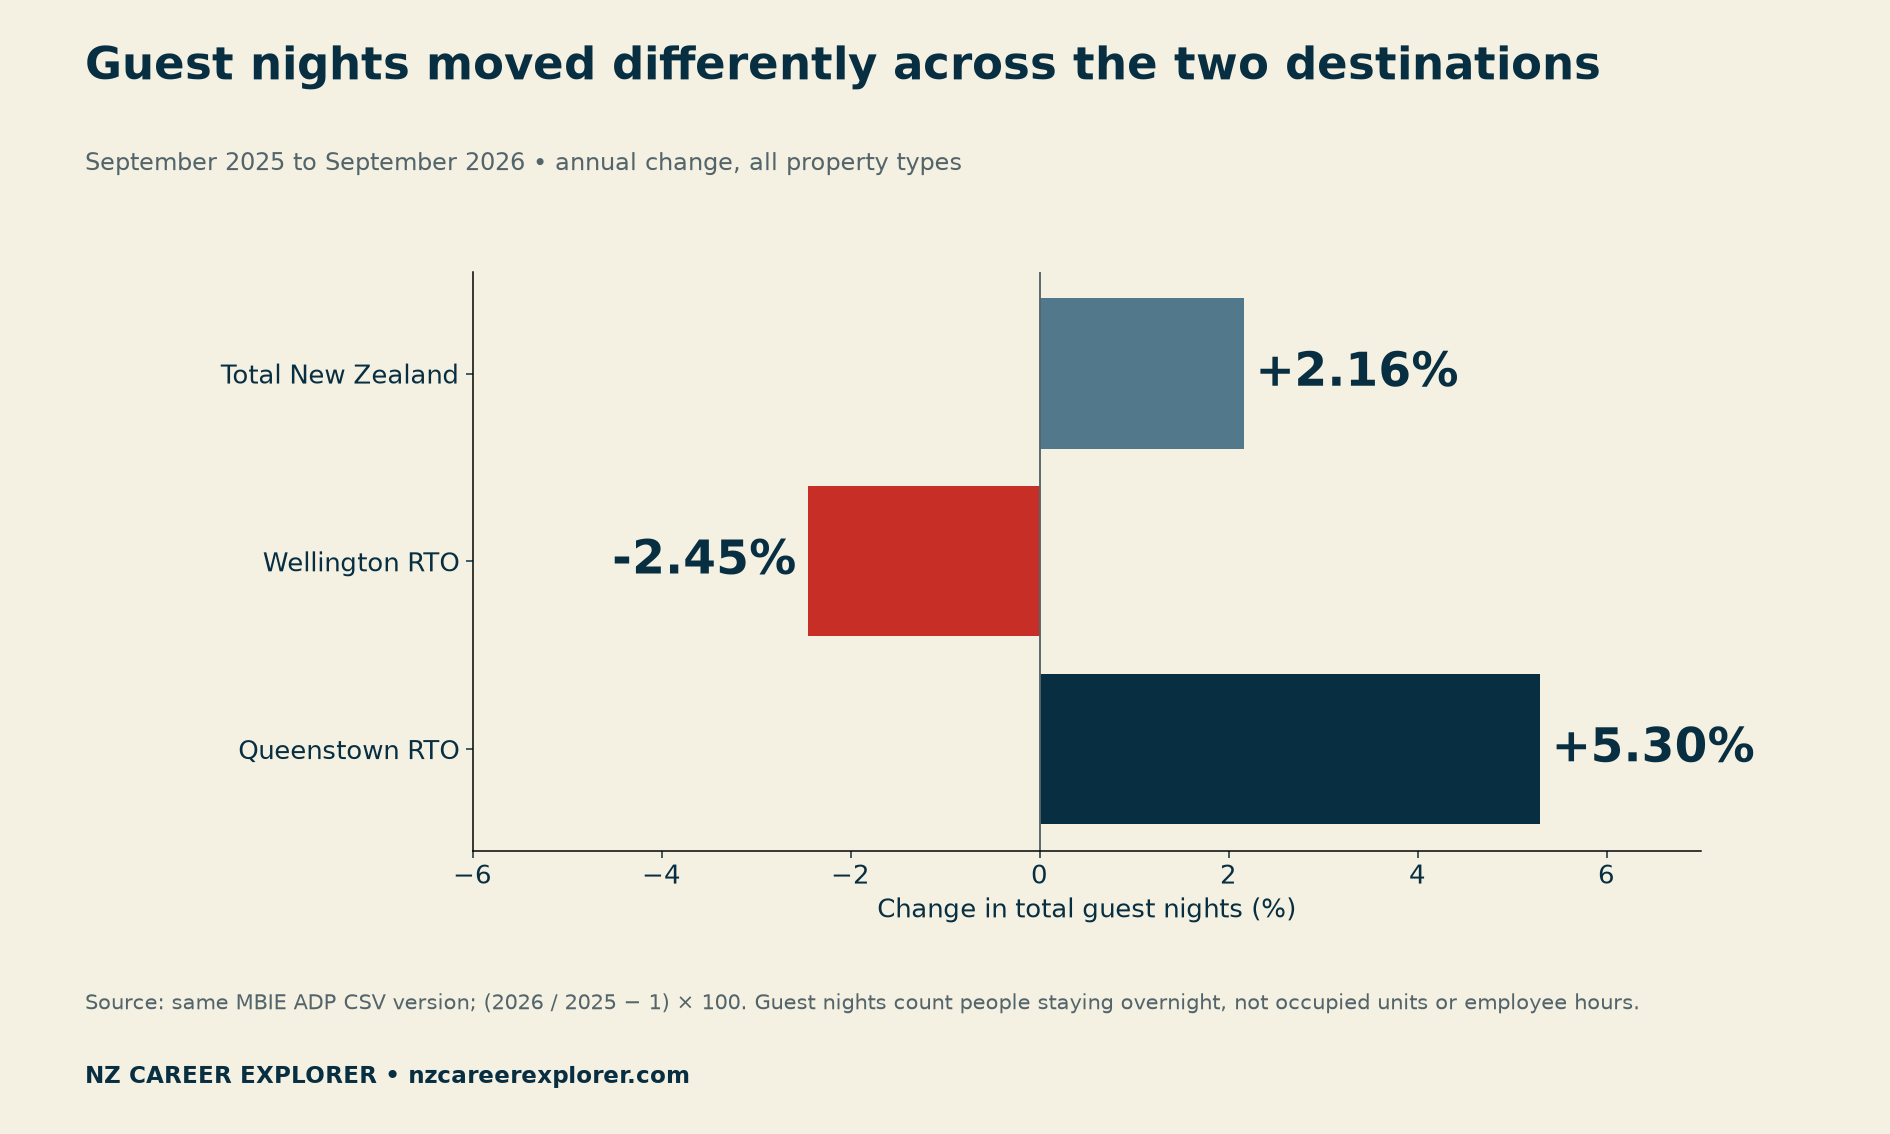
The MBIE Accommodation Data Programme release reports commercial accommodation activity. Its national total rose from 2,776,000 guest nights in September 2025 to 2,836,100 in September 2026. Our calculation gives a 2.16% annual increase. This national result does not describe every destination or property.
Queenstown RTO guest nights increased from 305,700 to 321,900, or 5.30%. Its published occupancy rate rose from 73.2% to 75.7%, a 2.5 percentage-point increase. Wellington RTO guest nights fell 2.45%, while occupancy increased 0.7 percentage points. Both comparisons use property type “Total,” rather than hotels alone.
A destination-level measure is useful background for an employer conversation. However, it is not the employer’s booking book or staffing plan. Properties can differ in customer mix, operating model and tasks. A regional increase cannot replace the written terms of the role you are considering.
Guest nights and occupancy measure different things
The Fresh Info ADP reporting tool defines guest nights as people staying overnight. Two guests staying three nights generate six guest nights. Occupancy instead divides occupied stay-unit nights by available stay-unit capacity. A stay unit can be a room, bed or site depending on the property type.
That distinction prevents a common error: treating an occupancy percentage as a headcount. Neither guest nights nor occupied units directly measures staff hours. This article makes no claim that Wellington employers cut shifts, or that Queenstown employers offer guaranteed extra work.
Wellington’s smaller denominator explains the puzzle
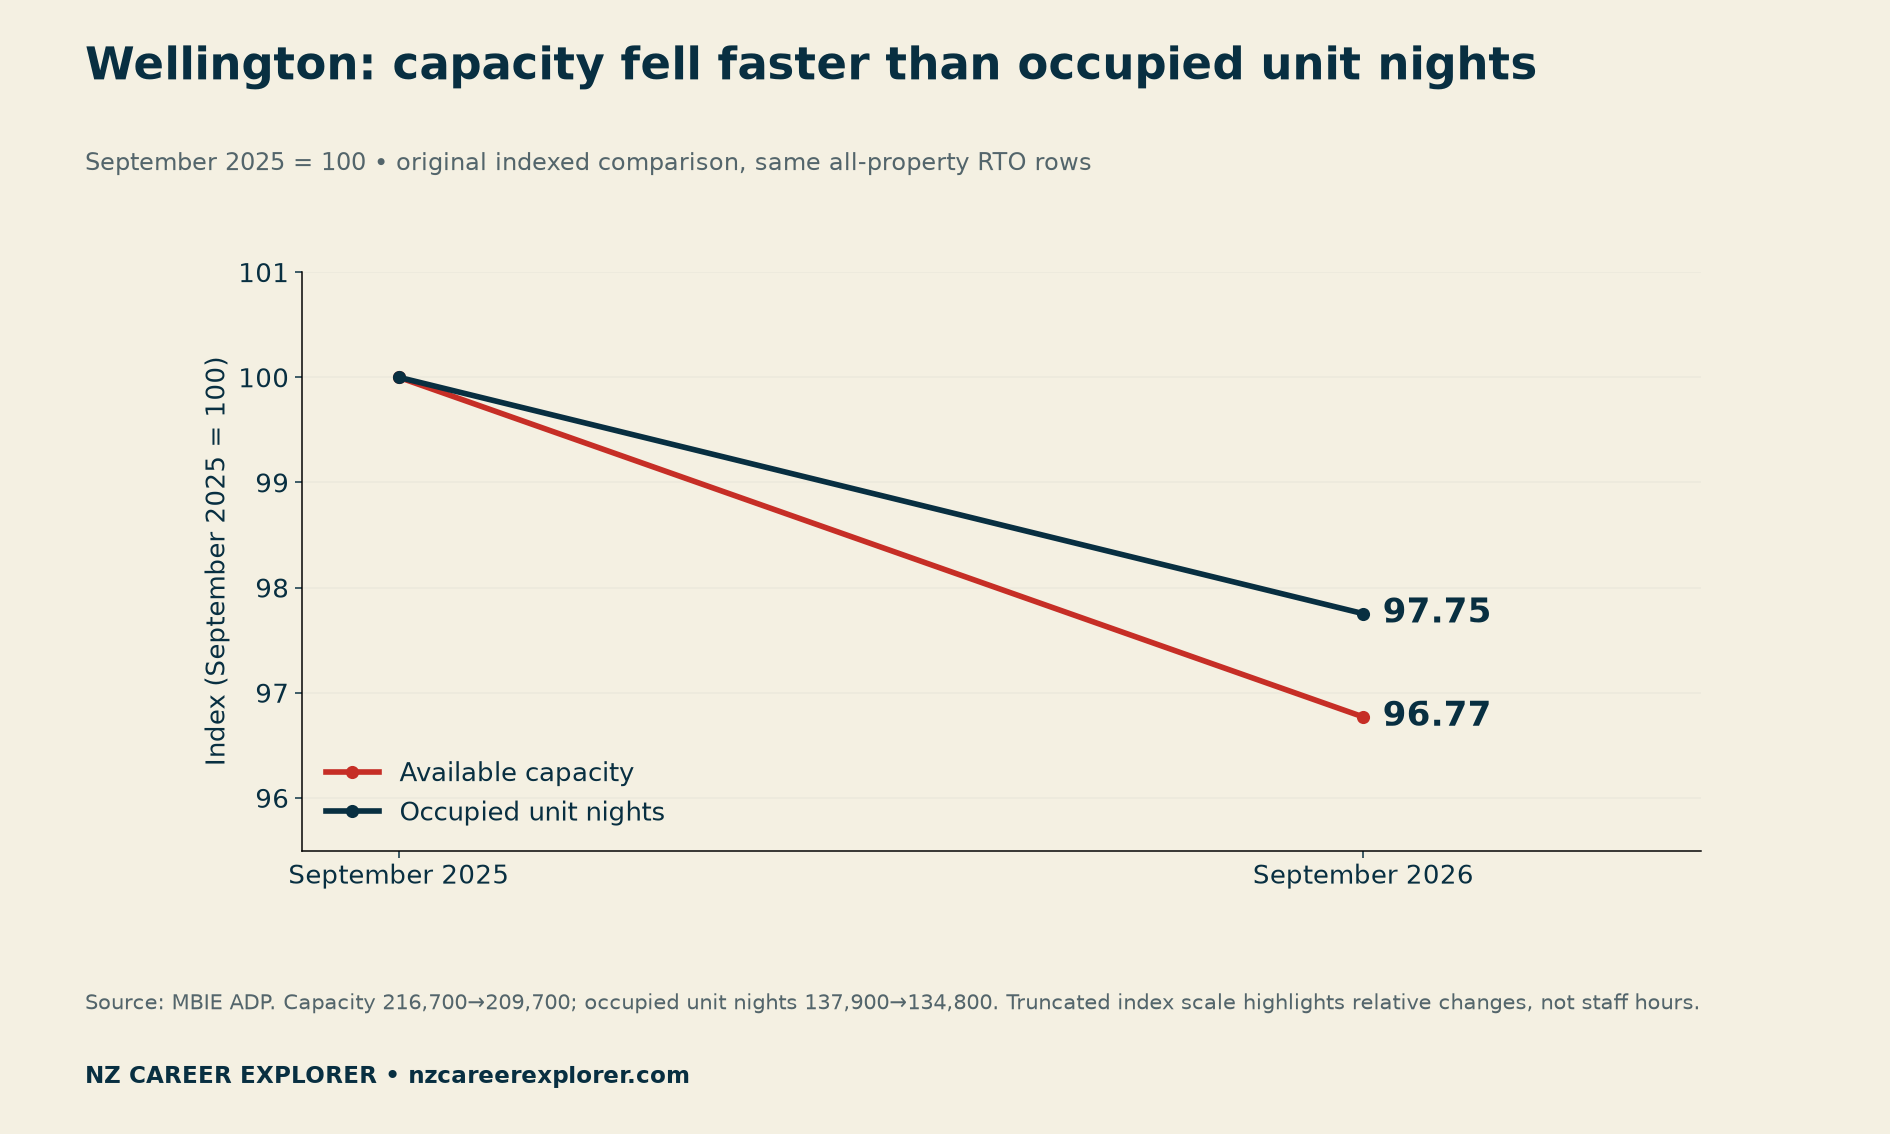
Available monthly stay-unit capacity in Wellington fell from 216,700 to 209,700. Occupied stay-unit nights fell from 137,900 to 134,800. Capacity declined by about 3.23%, while occupied unit nights declined by about 2.25%. Because the denominator fell faster, the occupancy ratio could rise.
The provider defines available capacity to exclude units temporarily removed from inventory, such as through closures or maintenance. The selected rows do not establish why each Wellington property changed capacity. We therefore explain the ratio without assigning a cause to a particular employer.
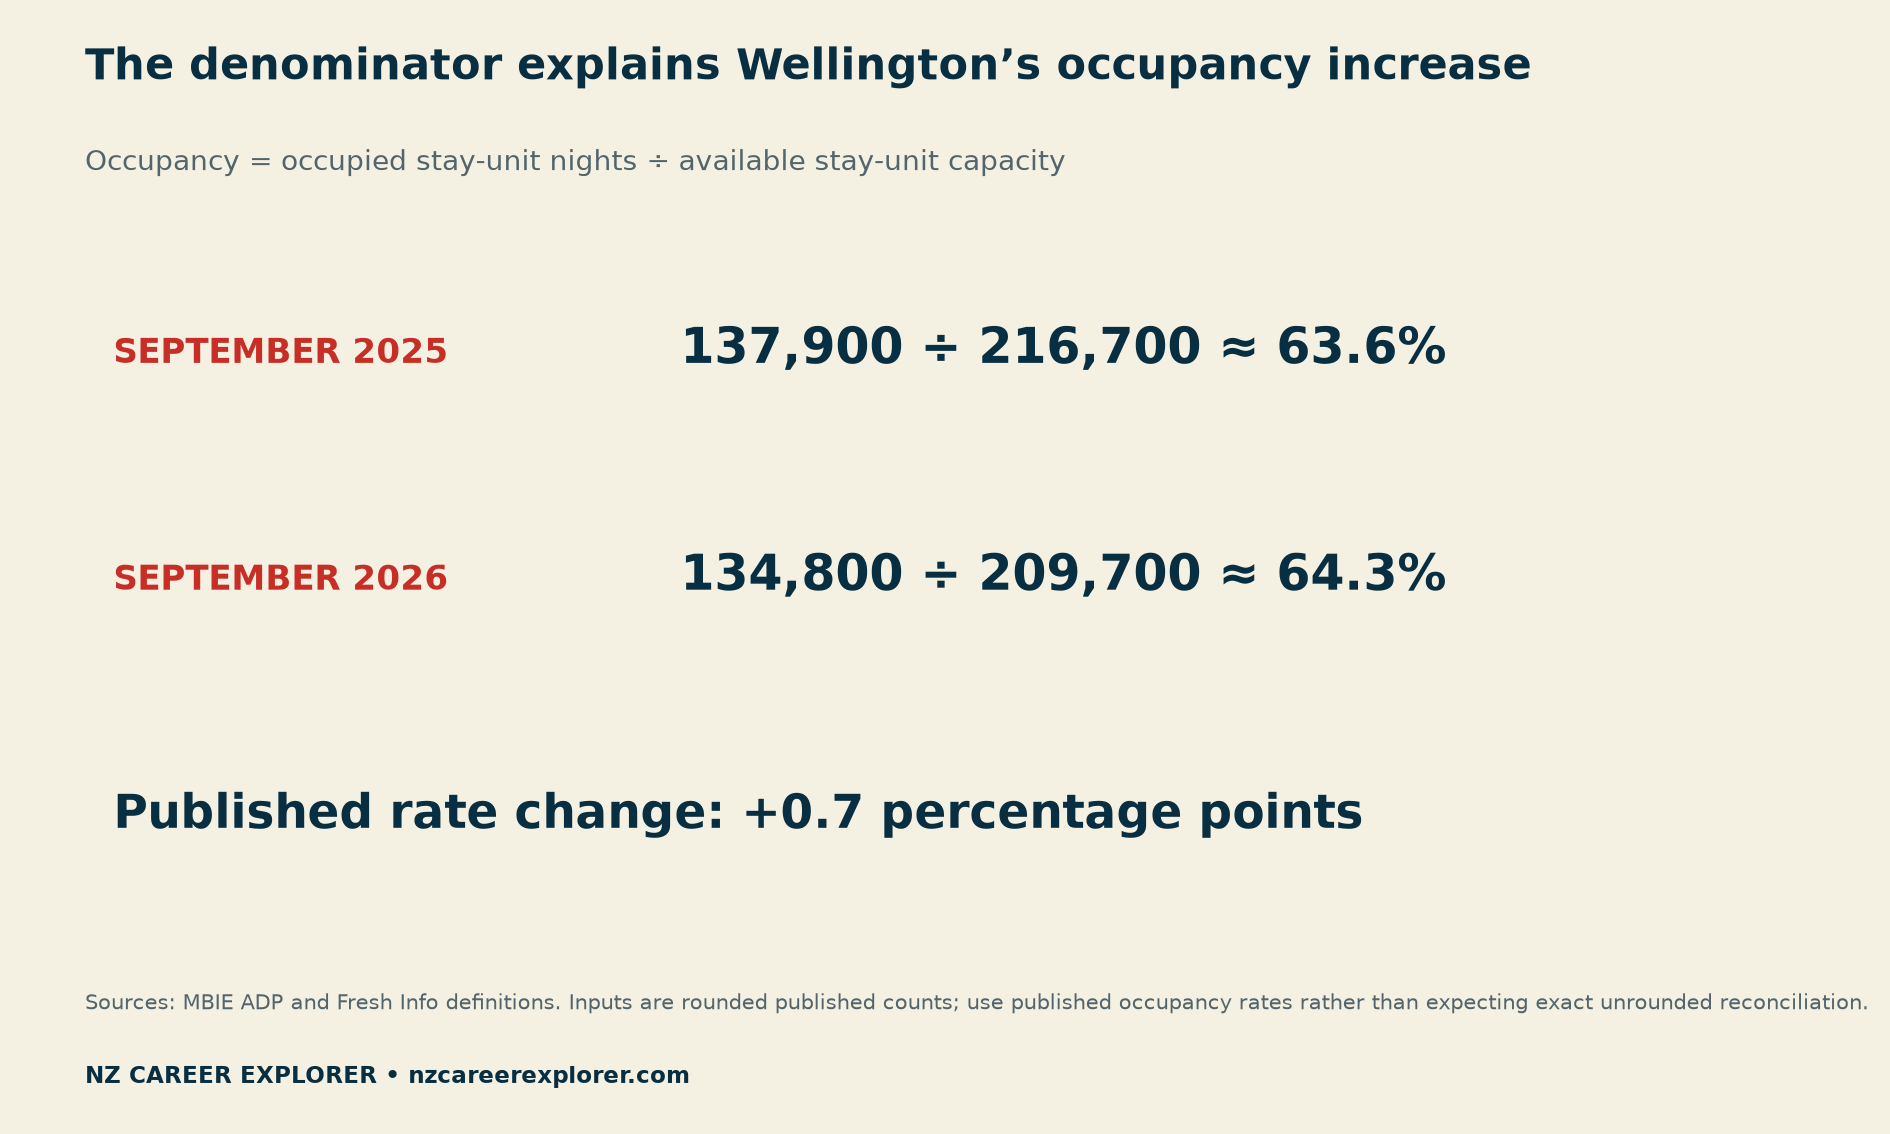
The published change is 0.7 percentage points. That is different from saying occupancy increased by 0.7%. More importantly for a jobseeker, neither phrasing supplies an extra number of hours for a personal budget.
Check seasonal accommodation jobs NZ offers against written hours
Compare seasonal accommodation jobs in NZ by their written terms. Ask which hours are confirmed in writing and which are only possible additions. Record the answer beside the employer, role and date. A phrase such as “busy season” is not a number of hours. If the offer leaves the position unclear, ask for clarification before building a budget around it.
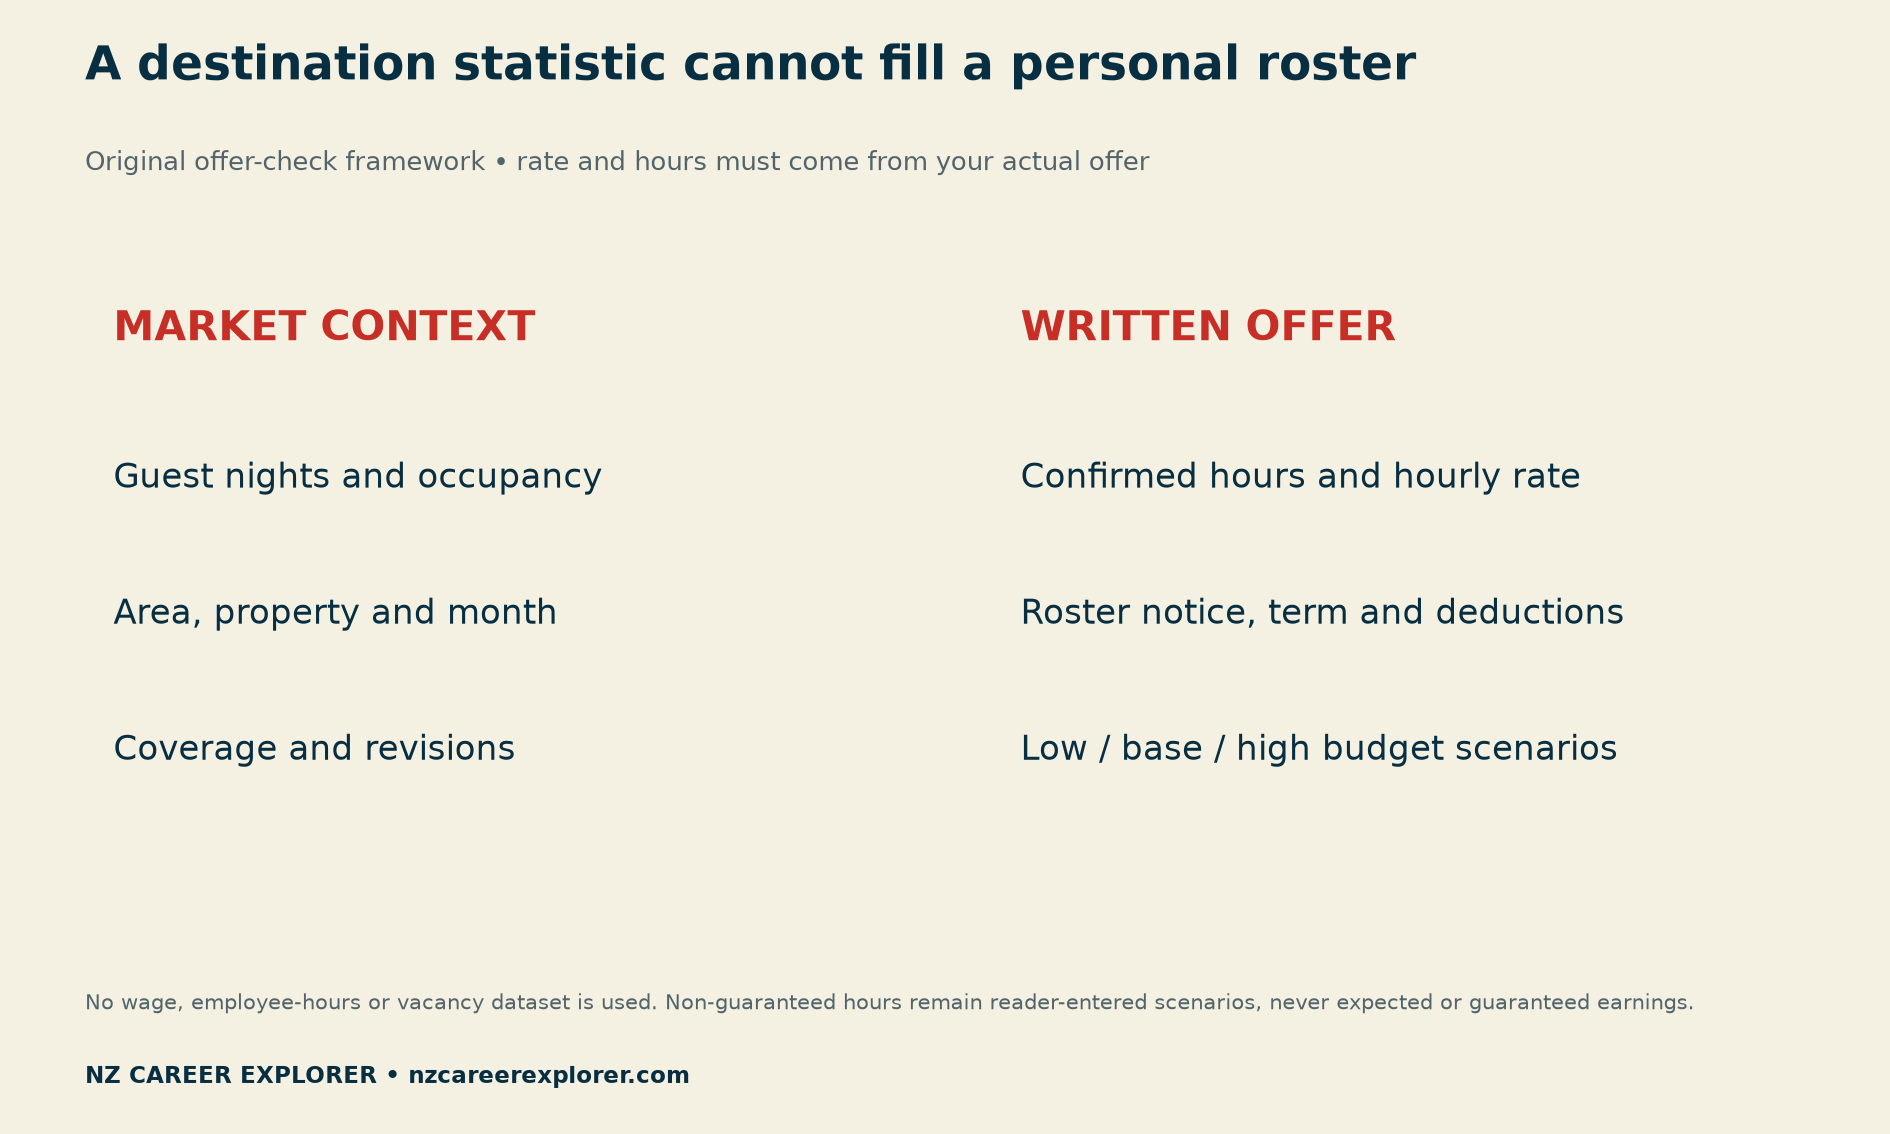
Next, ask about roster notice, changes and the length of the expected busy period. Check the actual work location and fixed-term end date. If accommodation is part of the arrangement, ask what is provided, what deductions or conditions apply and what happens when the job ends.
For newcomers, confirm the actual role’s work-right and qualification requirements through the employer and responsible official routes. A tourism-demand statistic does not establish sponsorship or eligibility. This report helps organise questions; it does not determine anyone’s immigration or employment status.
Personalized Career Consulting
Unlock your potential with expert career advice tailored to your goals. Get personalized guidance and actionable steps toward your dream career in New Zealand.
Get Started
Budget for seasonal accommodation jobs in NZ without extra shifts
A budget for seasonal accommodation jobs in NZ needs the actual offer. Use the offered hourly gross rate and hours you enter yourself. Multiplying the two gives weekly gross pay. Take-home pay needs its own verified estimate; do not treat gross pay as money available after deductions. Record living costs separately, including accommodation and travel where relevant.
The worksheet provides low, base and high scenarios. Where a written minimum exists, it may help anchor the low case. Otherwise, mark the missing commitment clearly. Base and high hours remain assumptions until supported by the actual arrangement; they are not forecasts of what the employer will roster.
Keep recurring costs separate from one-off moving expenses. Also consider the period after a fixed term ends. A plan that works only with every hoped-for additional shift needs a closer look. The tool intentionally leaves rates, hours and costs blank because no reader’s offer has been verified.
Our NZ pay-rise calculator guide provides a separate pay-and-hours comparison once you have actual offer details. Our September filled-jobs report explains why recorded employment and current vacancies also require separate evidence.
Download the comparison and offer-check tools
Selected accommodation source rows (CSV) preserves thirty rows covering three areas, two Septembers and five measures, including the quality indicators.
Calculated area comparison (CSV) includes levels, absolute changes, percentage-point changes and relative percentage changes with explicit units.
Blank weekly-hours sensitivity sheet (CSV) provides low, base and high rows with plain-language formulas. Enter the offer’s actual rate and your own hours and cost assumptions; CSV files do not calculate the text formulas automatically.
Written-offer interview checklist (CSV) records answers on hours, rosters, term, accommodation, travel and requirements. Keep personal information in your own copy rather than posting it publicly.
Methodology, coverage and revisions
We downloaded the raw MBIE ADP CSV on 31 October and selected area type “RTO,” property “Total,” and September 2025 and 2026. The national row is “Total New Zealand”; it is not added to constituent RTOs. Each area-period combination appears once per selected measure. All six selected totals carry “High” quality indicators.
Percentage change equals the 2026 value divided by the 2025 value, minus one, multiplied by 100. Occupancy percentage-point change uses the difference between published rates. For the denominator chart, each September 2025 count is indexed to 100. Scripts and the original source version are retained for reproduction.
The release notice says updated RTO boundaries apply across the full series; Fresh Info records the historical revision on 29 October. We therefore compare both years from the same downloaded version. Estimates remain subject to revisions and sampling limitations. A “High” flag does not mean every small change is statistically significant.
The programme generally covers commercial providers with at least six stay units, rather than every holiday home or small provider. The article contains no employer-level roster evidence, verified wage survey or vacancy sample. Its original contribution is the denominator comparison and offer-budget framework. Suggested citation: NZ Career Explorer, “NZ Accommodation Jobs: Check Demand Before Relying on Extra Shifts,” 31 October 2026. Underlying accommodation data: MBIE/Fresh Info, CC BY 4.0; calculations and visual adaptations by NZ Career Explorer.


