







Show primary care administration skills in NZ with a small case study about cancellation offers. Begin with one question you can answer: would a clearer contact preference help the practice reach people who choose to receive earlier appointment offers? Then show how you would measure it with entirely fictional records.
The Ministry of Health’s 2025/26 New Zealand Health Survey release estimates that 42.9% of people aged 15 or older and 23.4% of children aged 0–14 experienced an unmet need to see a GP in the year before their interview. The survey gives national context for why access matters. A local practice would need its own evidence to understand a specific booking process.
Primary care administration NZ skills start with a clear measure
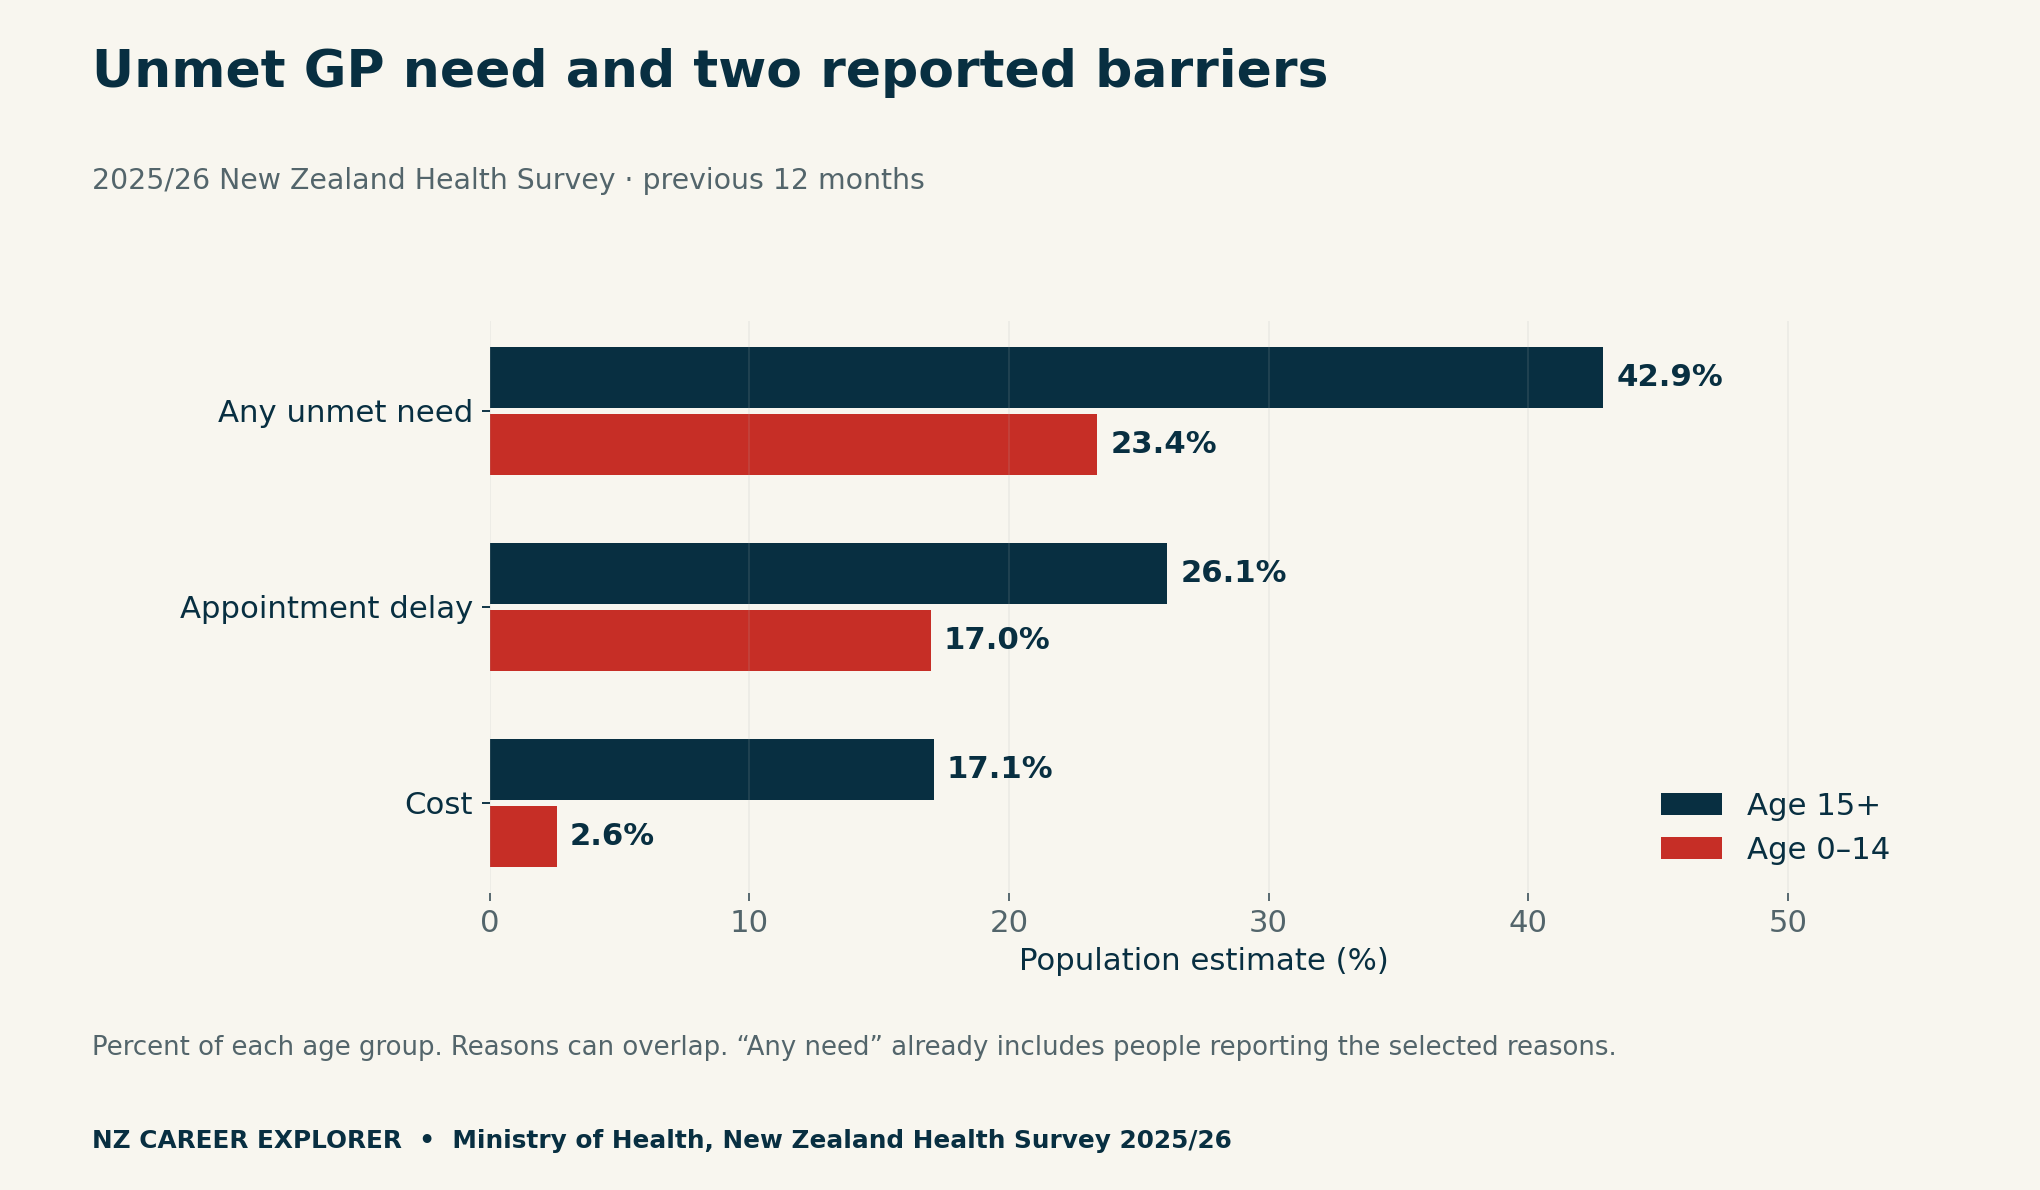
Appointment delay was the most commonly reported reason. It affected 26.1% of adults and 17.0% of children. Meanwhile, 17.1% of adults and 2.6% of children reported cost as a barrier. Those are percentages of the corresponding age groups. If you want the percentage among people with any unmet need, you need that smaller denominator.
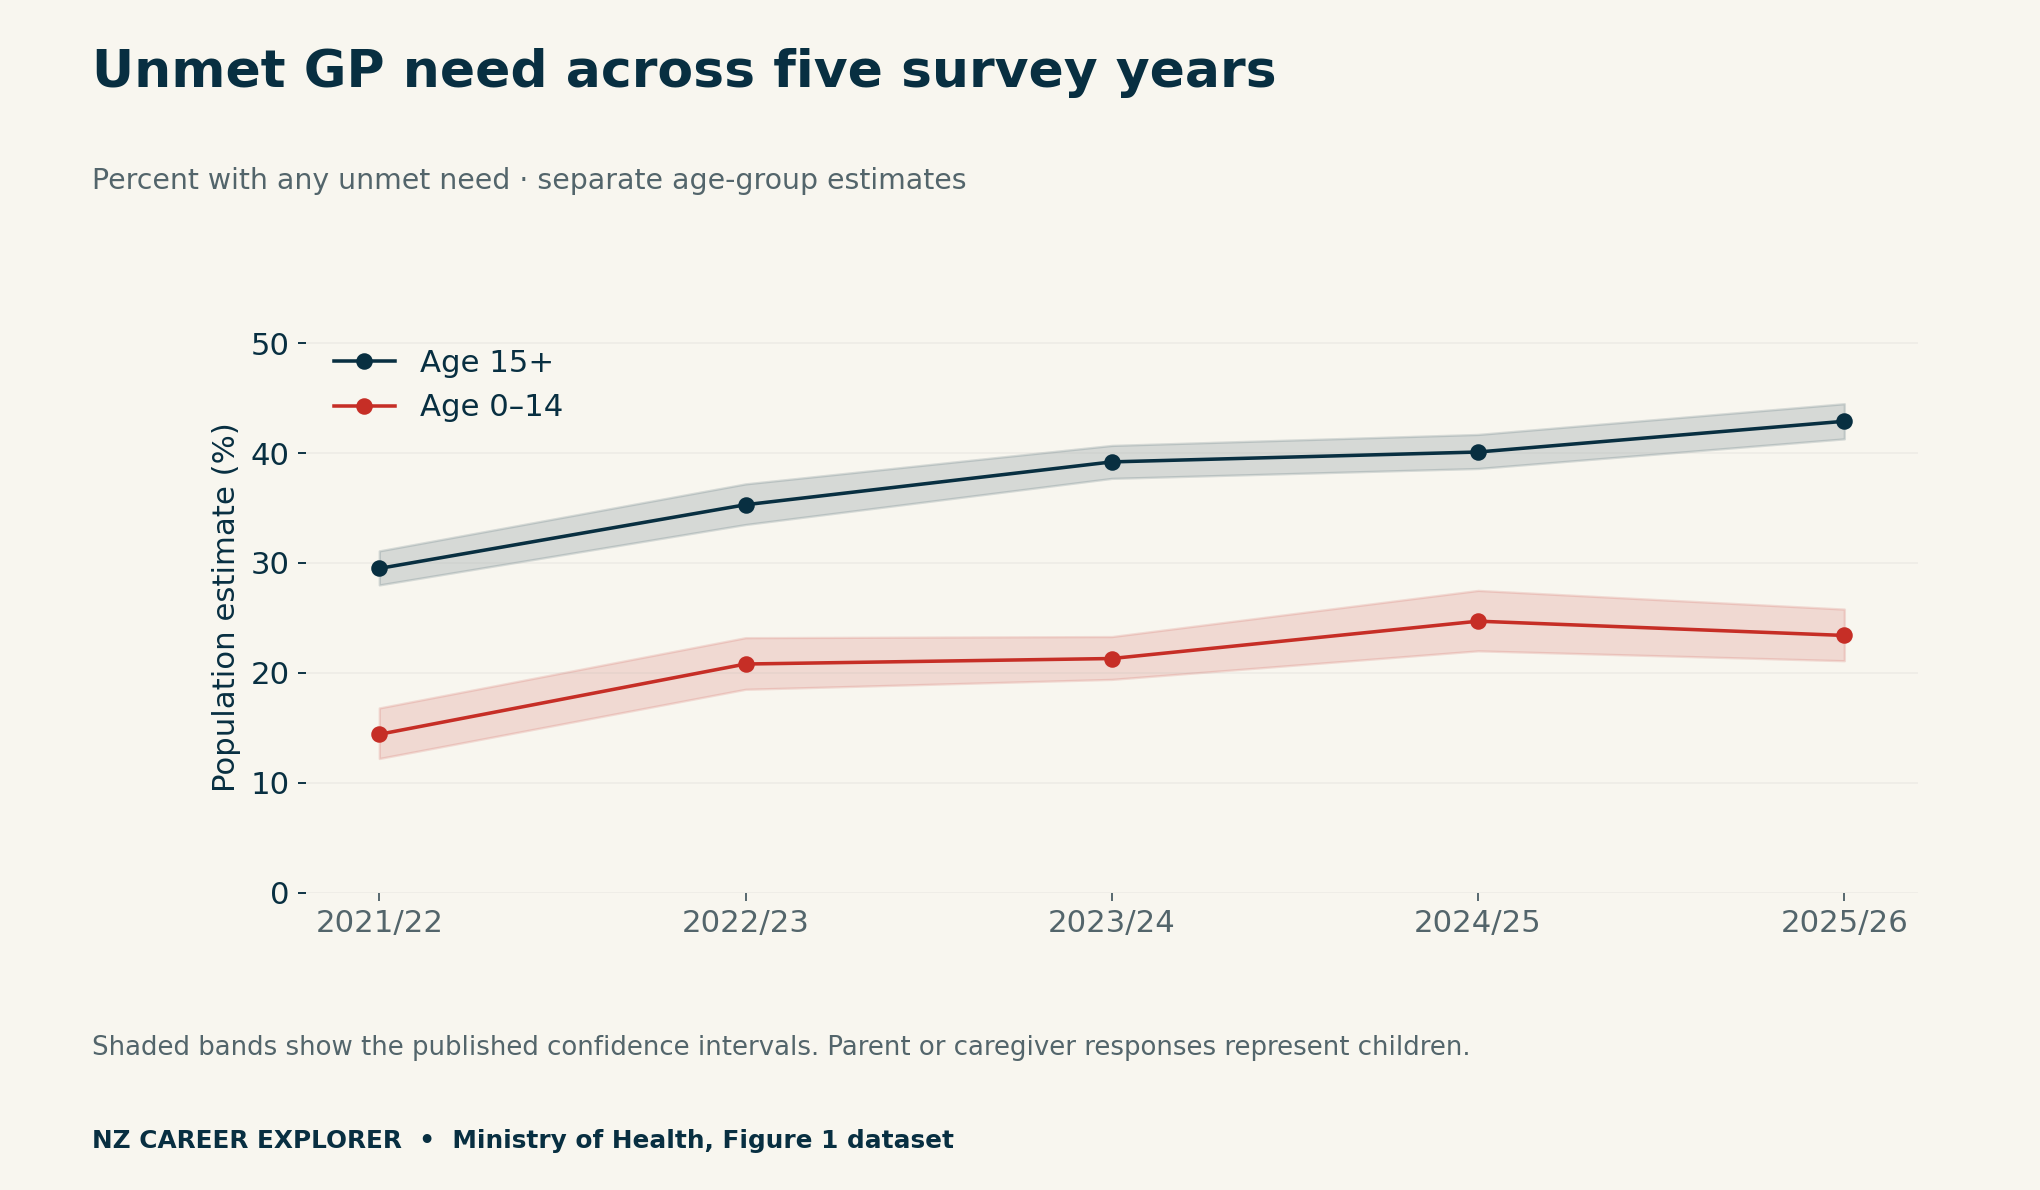
Interviews took place from July 2025 to July 2026. Each interview asked about experiences over the previous 12 months, and parents or caregivers answered for their children. As a result, the survey period describes fieldwork and does not define one fixed calendar window for every reported experience. It also does not count missed appointments in individual practices.
Design a small change to cancellation offers
Suppose a fictional practice sometimes sends cancellation offers through a channel that the intended recipient rarely checks. Start by mapping the existing sequence: opt in, record preference, offer a suitable slot under the practice’s policy, and record the acknowledgement. Next, propose asking for a preferred available contact method at opt-in.
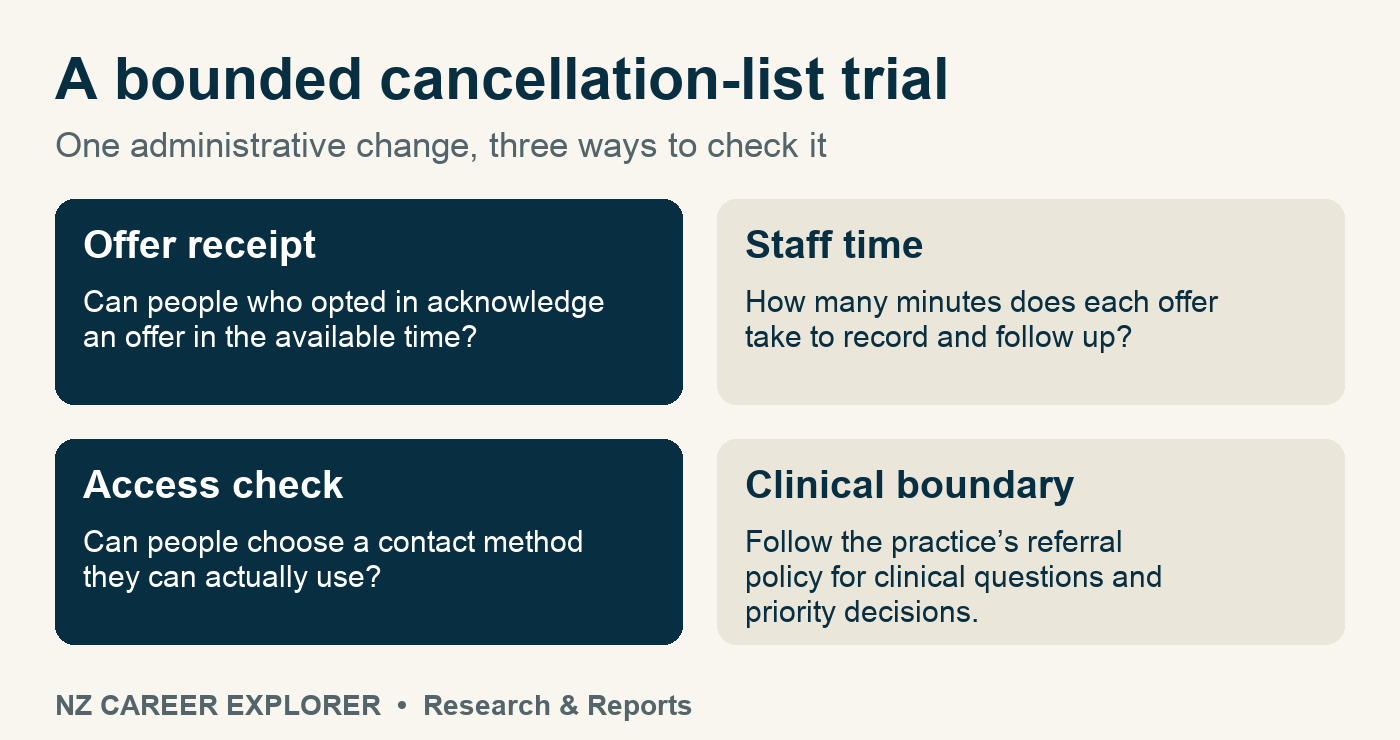
For illustration, the sample log has three invented offers, two acknowledgements within the example window, and one person who declined offers. Two divided by three describes acknowledgements among offers sent. Including the person who opted out in that denominator would turn a preference choice into a supposed contact failure.
Then check for trade-offs. A clearer offer can still increase staff time if the practice has to record the same preference twice. A faster channel can exclude people who cannot use it. Track time per offer and keep an alternative contact option visible. Compare similar time windows before drawing even a provisional conclusion.
Keep clinical decisions and private records out of your work sample
Use synthetic IDs, invented times and routine administrative outcomes. Leave names, contact details, medical history and identifiers out. If a real process raises clinical priority or a care question, the practice’s designated clinical team handles it under its policies. An applicant can demonstrate the handoff without proposing a clinical decision.
Finally, explain what this change could plausibly improve: someone may see and respond to an offer sooner. A better message does not make a visit affordable or create clinical capacity. For broader context, our filled-jobs analysis shows how employment figures answer a separate question from patient access.
Methods and practice files
The grouped chart uses the Ministry’s 18 November 2026 release. The trend chart uses its downloadable Figure 1 dataset, converted from proportions to percentages with the published intervals. The case, sample log and measurement plan are original fictional resources. Cite the New Zealand Health Survey release when reusing a survey estimate.


