





NZ migrant employment education statistics can provide useful context before you buy another course. However, a population employment rate cannot tell you whether a particular programme will improve your job prospects. Start by separating the broad pattern from the evidence your own decision needs.
The latest OECD report offers a clear example. Its New Zealand table compares employment across education and birthplace groups. Below, we reproduce the rates, calculate the differences and provide blank tools for checking course claims, role requirements and costs.
NZ migrant employment education: what the new table measures
The International Migration Outlook 2026 country page gives a publication date of 12 November 2026. The relevant employment observations are for 2025, not November 2026. In Annex Table 1.A.7, the age range is 15–64 and the groups are foreign-born and native-born.
Across low, medium and high education, foreign-born employment rates were 68.8%, 83.0% and 88.4%. Native-born rates were 65.5%, 82.1% and 91.1%. The table identifies New Zealand’s Labour Force Survey as the source. We retain the OECD education labels rather than inventing a mapping to named local courses.
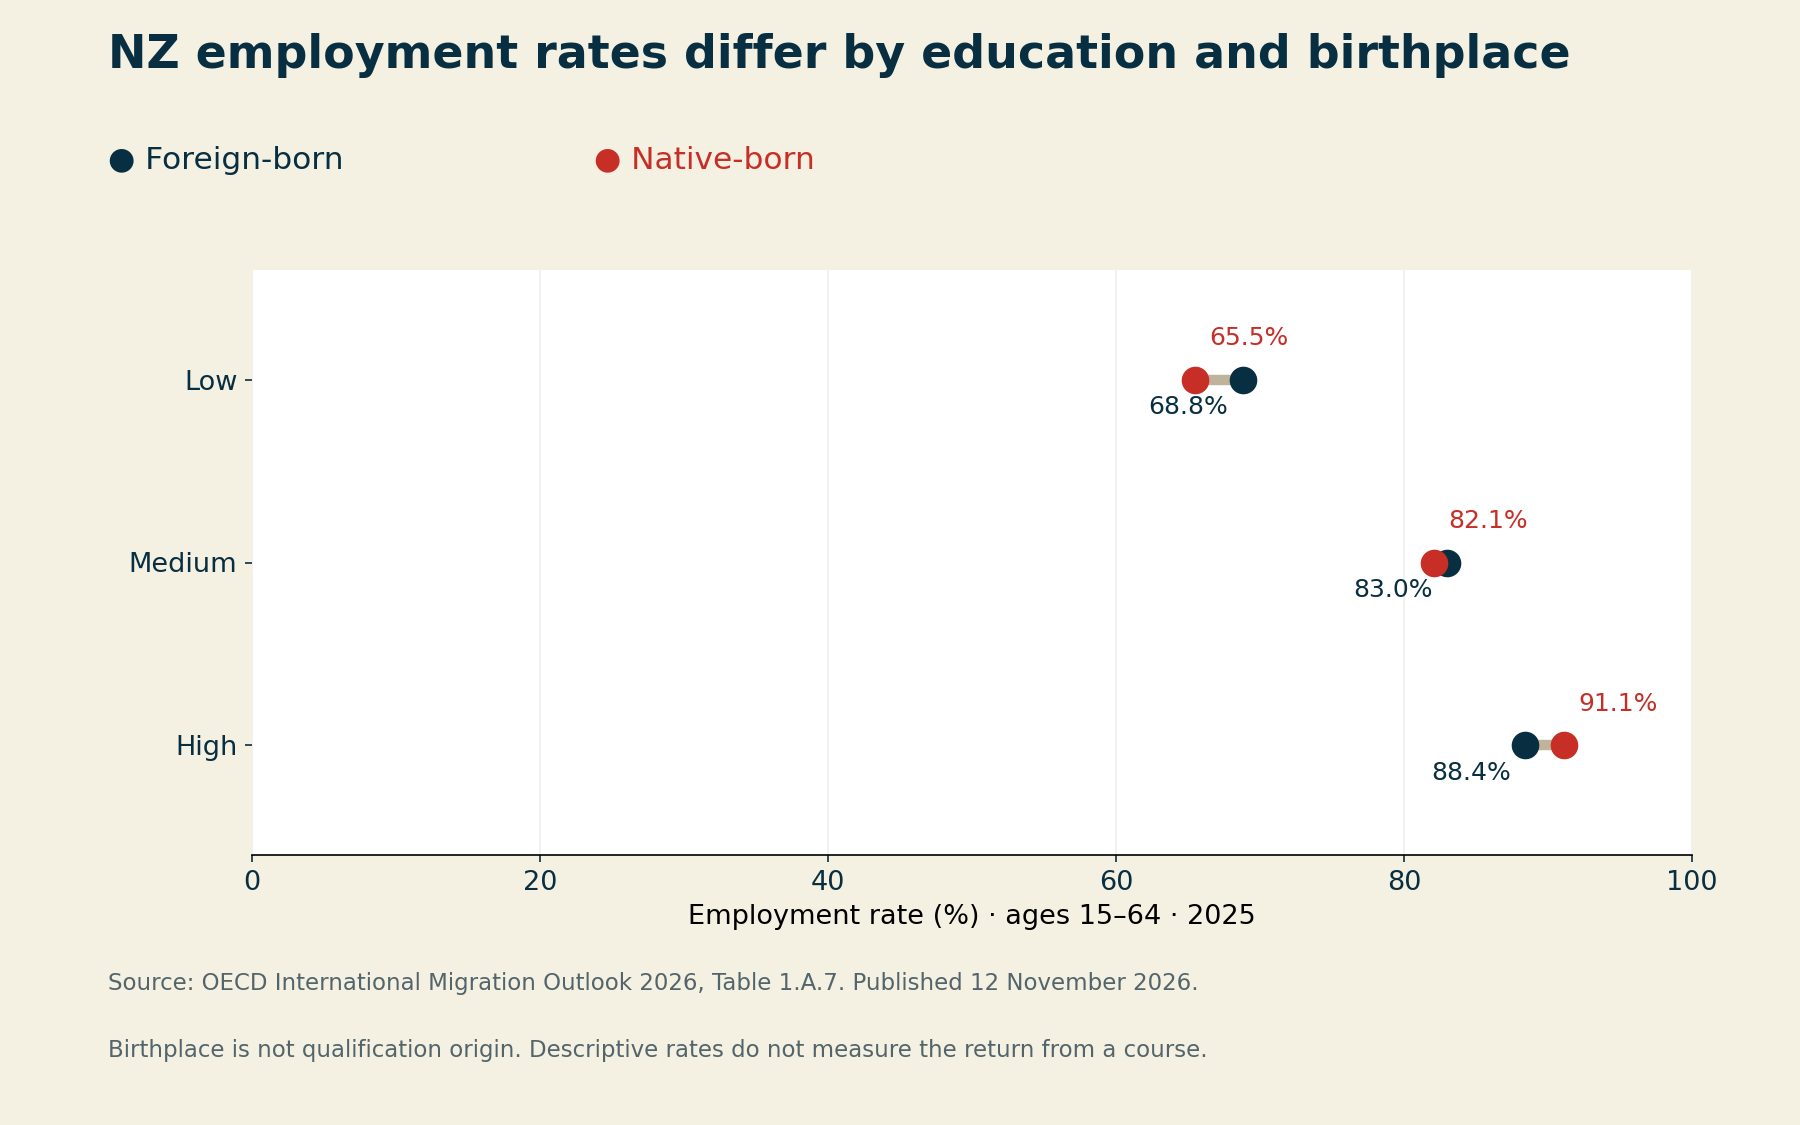
| OECD education group | Foreign-born | Native-born | Difference |
|---|---|---|---|
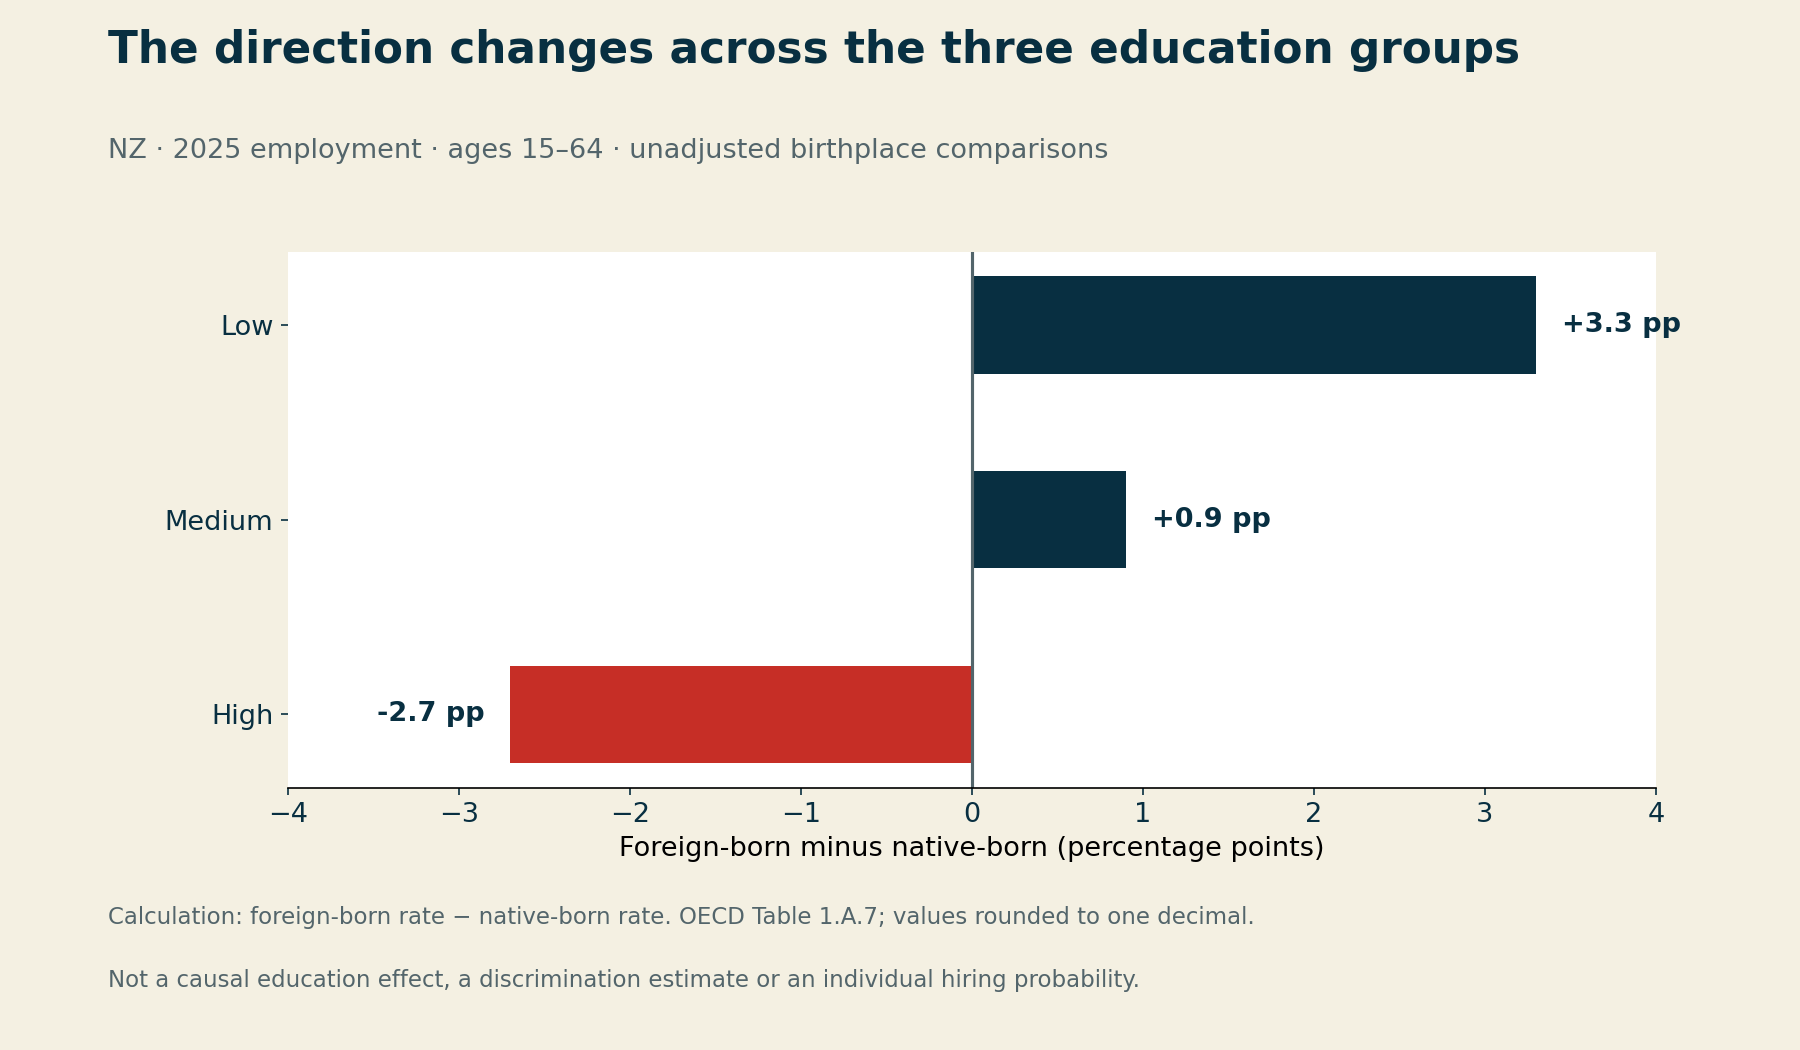
| Low | 68.8% | 65.5% | +3.3 pp |
| Medium | 83.0% | 82.1% | +0.9 pp |
| High | 88.4% | 91.1% | −2.7 pp |
The differences use simple subtraction: foreign-born minus native-born. For example, 88.4 − 91.1 = −2.7 percentage points in the high-education group. Percentage points describe the gap between rates; they are not the same as a relative percentage change.
Why a group rate cannot price the value of a course
Birthplace is not qualification origin. A foreign-born person may have studied in New Zealand, overseas or both. Therefore, this comparison cannot establish that an overseas qualification performs worse than a New Zealand qualification.
Likewise, employment is not a measure of full-time work, salary, occupational match or satisfaction. The table does not track graduates of a named provider. It also does not isolate recent arrivals or estimate your personal chance of receiving an offer.
These descriptive comparisons do not control for every difference in age, experience, work rights or group composition. Consequently, the rates cannot establish a causal course return or explain an individual rejection. Nor should you average the three percentages into an overall rate without the appropriate group counts.
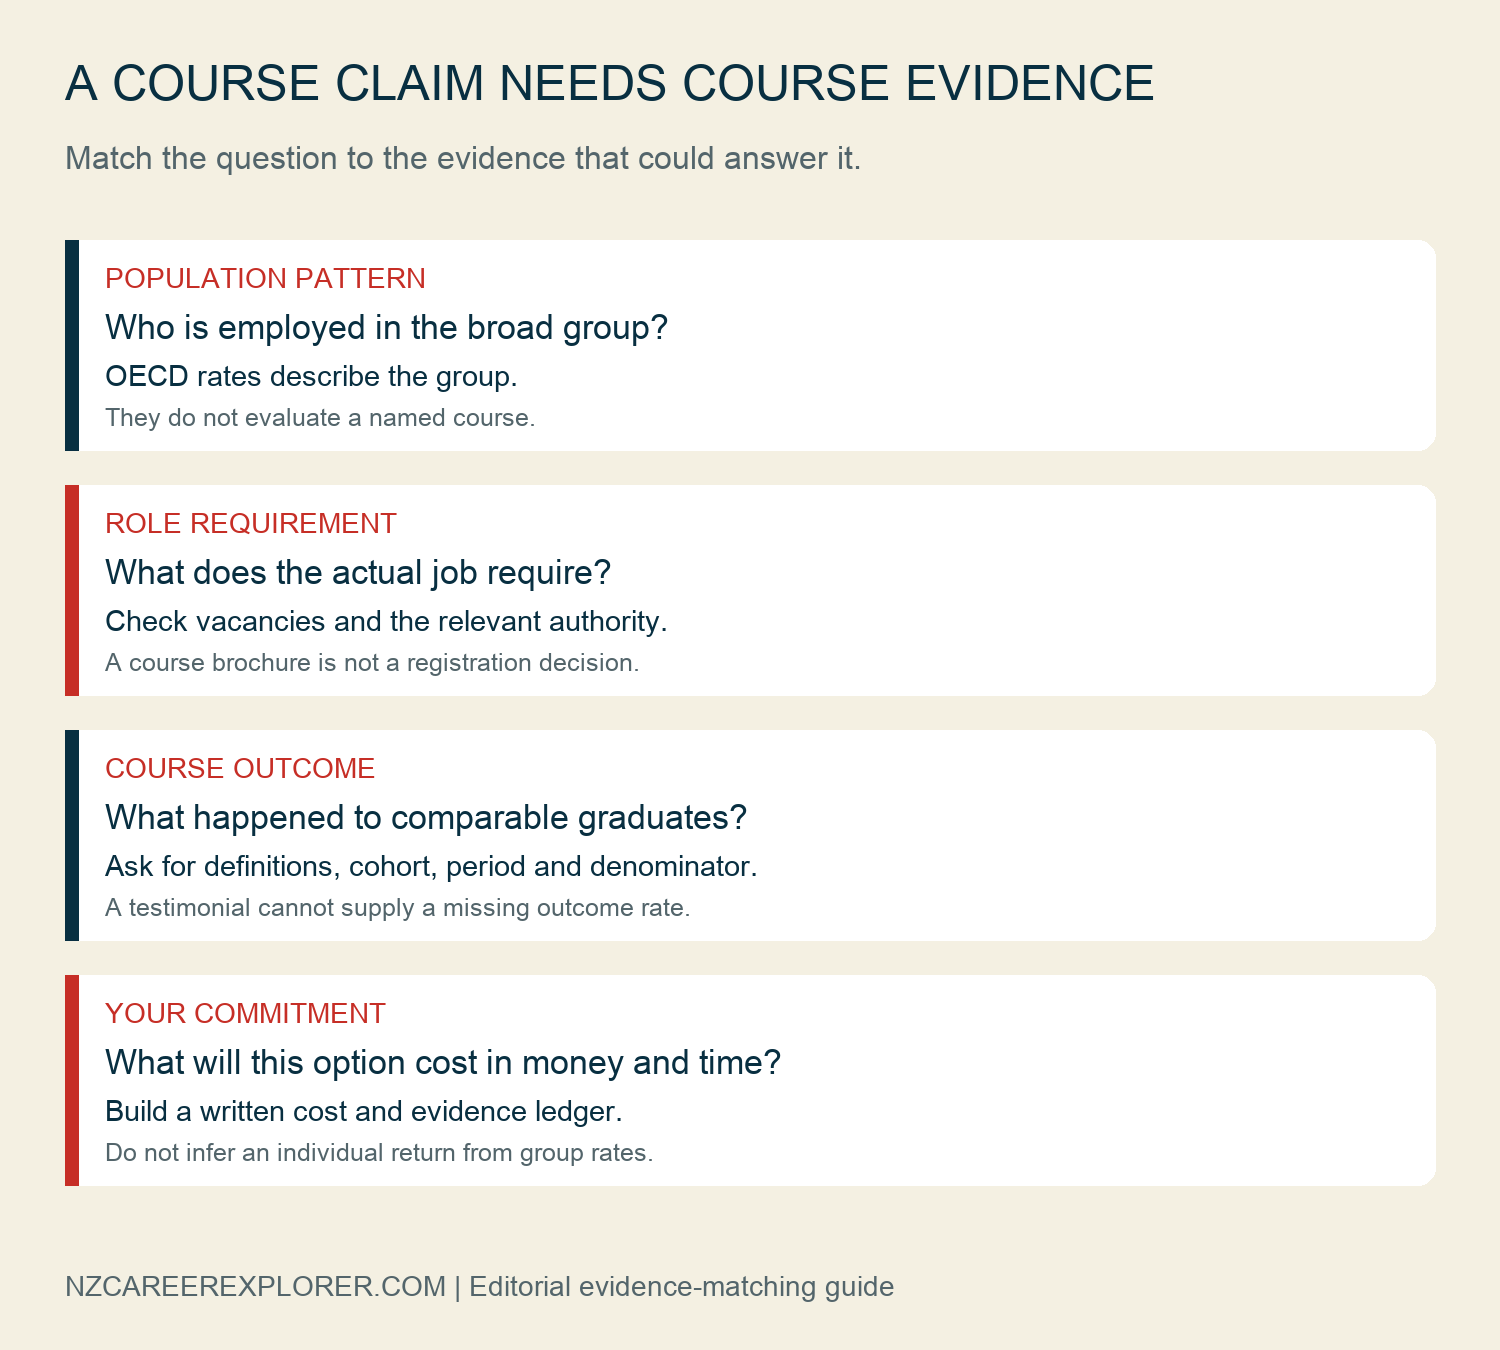
The practical question is narrower: what evidence would justify this particular commitment? A course can be useful for many reasons, but those reasons need their own support. A broad statistical association cannot replace a clear requirement, a relevant skill gap or credible programme outcomes.
Match each course claim to the right evidence
Start with the target role
Write a specific role and the duties you want to perform. Then inspect current vacancies, separating essential qualifications from desirable skills. Record the exact wording and checked date instead of relying on a provider’s general description of industry demand.
The NZQA qualification-choice guide recommends researching the job market and discussing options with employers and graduates. Use those conversations to test the relevance of a course. They do not guarantee selection, so keep opinions separate from formal requirements.
Our beginning-teacher vacancy comparison demonstrates this distinction. Similar job titles can carry different suitability gates. Buying training before reading those gates can leave the original eligibility question unanswered.
Check recognition only where it is needed
Some decisions require an assessment or occupational registration; others do not. The NZQA International Qualification Assessment guidance says to confirm whether you need an assessment before applying. Avoid paying for one simply because a marketing page suggests every migrant requires it.
NZQA’s employer explanation of an IQA also distinguishes qualification recognition from work experience and individual competency. An assessment is not automatically a job offer or a professional registration decision.
If your target occupation is regulated, consult the relevant authority about its current requirements. Record the answer and its scope. Do not assume that another person’s course, assessment or registration route applies to you.
Personalized Career Consulting
Unlock your potential with expert career advice tailored to your goals. Get personalized guidance and actionable steps toward your dream career in New Zealand.
Get StartedAsk what the provider’s outcome claim actually counts
A useful question is: “Which graduates, over what period, achieved which outcome?” Request the cohort, denominator, response rate and definition of employment. Also ask whether results distinguish any job from work related to the programme.
A testimonial can describe one person’s experience. However, it does not supply a missing cohort denominator. Similarly, a high response-based employment rate needs context about non-respondents, timing and who entered the course in the first place.
Keep the provider’s wording next to your evidence request. If no answer is available, mark it unknown rather than filling the gap with an optimistic assumption. Missing evidence is a reason to investigate; it is not proof that the programme has no value.
Compare the study commitment with alternatives
List tuition, required materials, travel, assessment fees where relevant and any changes to paid work or care arrangements. Use written quotes and current conditions. Keep confirmed amounts separate from estimates and leave an unknown amount blank.
Next, compare the proposed commitment with other ways to address the same gap. These may include a shorter module, an assessed work sample, supervised practice or a direct clarification from an employer. The appropriate option depends on the role; this article does not rank providers.
The Tahatū study-choice guide also highlights delivery modes, provider connections and learning circumstances. A programme’s fit involves time, location and support as well as its title. Check refund conditions before making a financial commitment.
Download the rates and decision worksheets
- NZ employment rates and calculated differences (CSV)
- Blank course-claim evidence worksheet (CSV)
- Blank target-role vacancy check (CSV)
- Blank course cost and time ledger (CSV)
The first file contains the three OECD rows and our percentage-point calculations. The remaining files are blank editorial tools. They contain no observed provider outcomes or invented salary returns. Add only evidence you can trace, and avoid recording sensitive immigration or identity information.
Method, limitations and citation
We checked the OECD publication and Table 1.A.7 on 14 November 2026. We transcribed the New Zealand rates, retained their one-decimal precision and subtracted native-born from foreign-born within each education group. Charts show the same six values and three differences; they introduce no additional observations.
The article’s course-evidence framework is our editorial analysis, not an OECD evaluation of a provider. It supports a more specific investigation, not a promise of employment or financial return. Suggested citation: NZ Career Explorer, NZ Migrant Employment and Education: Check the Rates Before Buying a Course, 14 November 2026, using OECD 2025 employment observations.


