







Use NZ policy analyst household projections as the starting evidence for a short work sample. Stats NZ’s national medium B scenario reaches 2.47 million households by 2048. A council memo can explain what this scenario implies for planning, which local figures still matter and where an approved budget would be needed.
The 11 November 2026 Stats NZ release starts from an estimated 30 June 2023 base of 1.90 million households. Medium B combines a median national population scenario with changing living arrangements modelled using earlier census data. The release provides alternative assumptions as well. Use its population statistics user guide to understand how the series interacts with other projections.
NZ policy analyst household projections use explicit assumptions
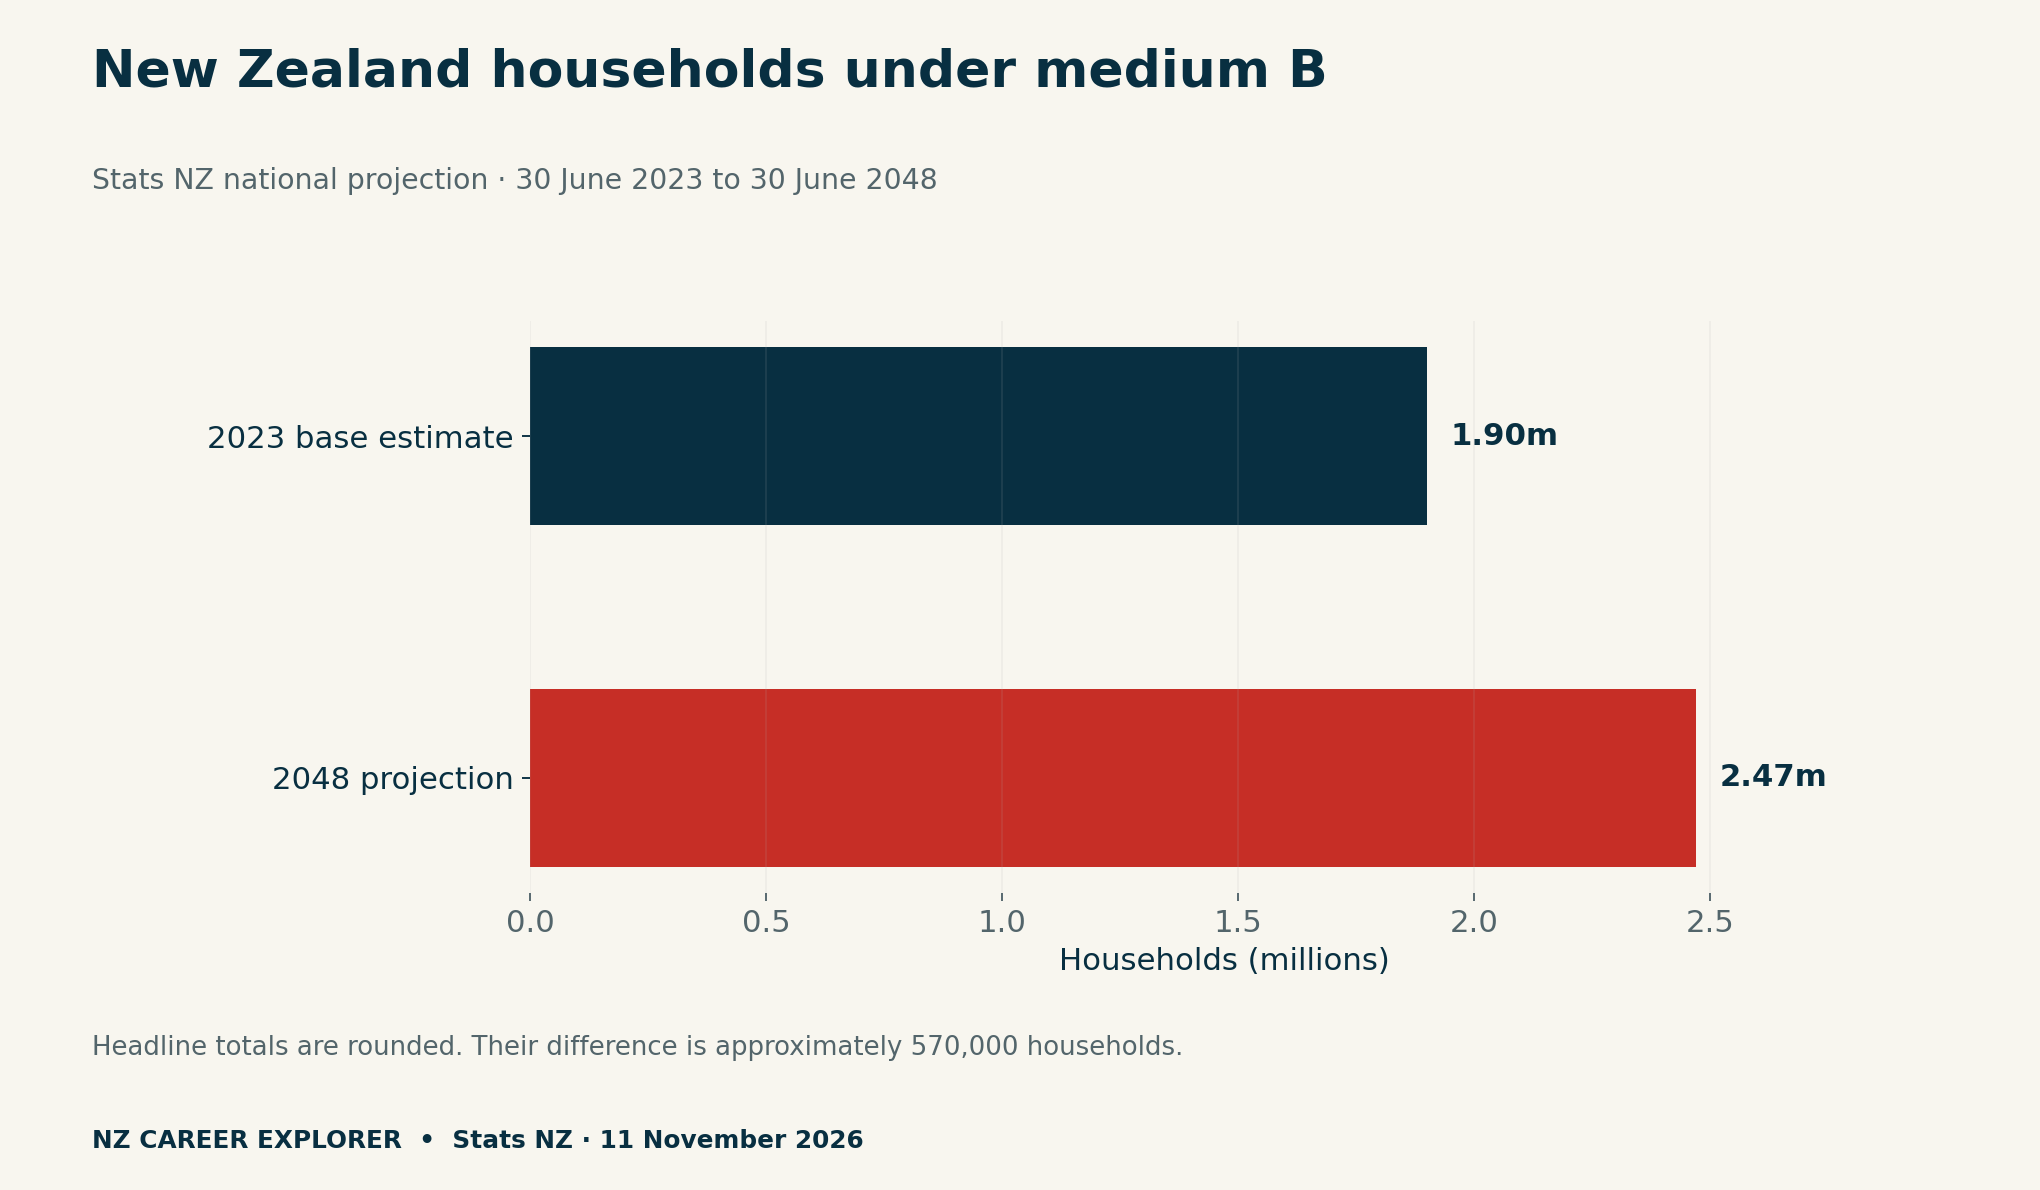
First, label the 2023 figure as an estimated base and 2048 as a projection. Next, state the geography and unit: all households in New Zealand. This tells your reader how to interpret the number and helps them spot when a slide has switched to people, properties or one council’s area.
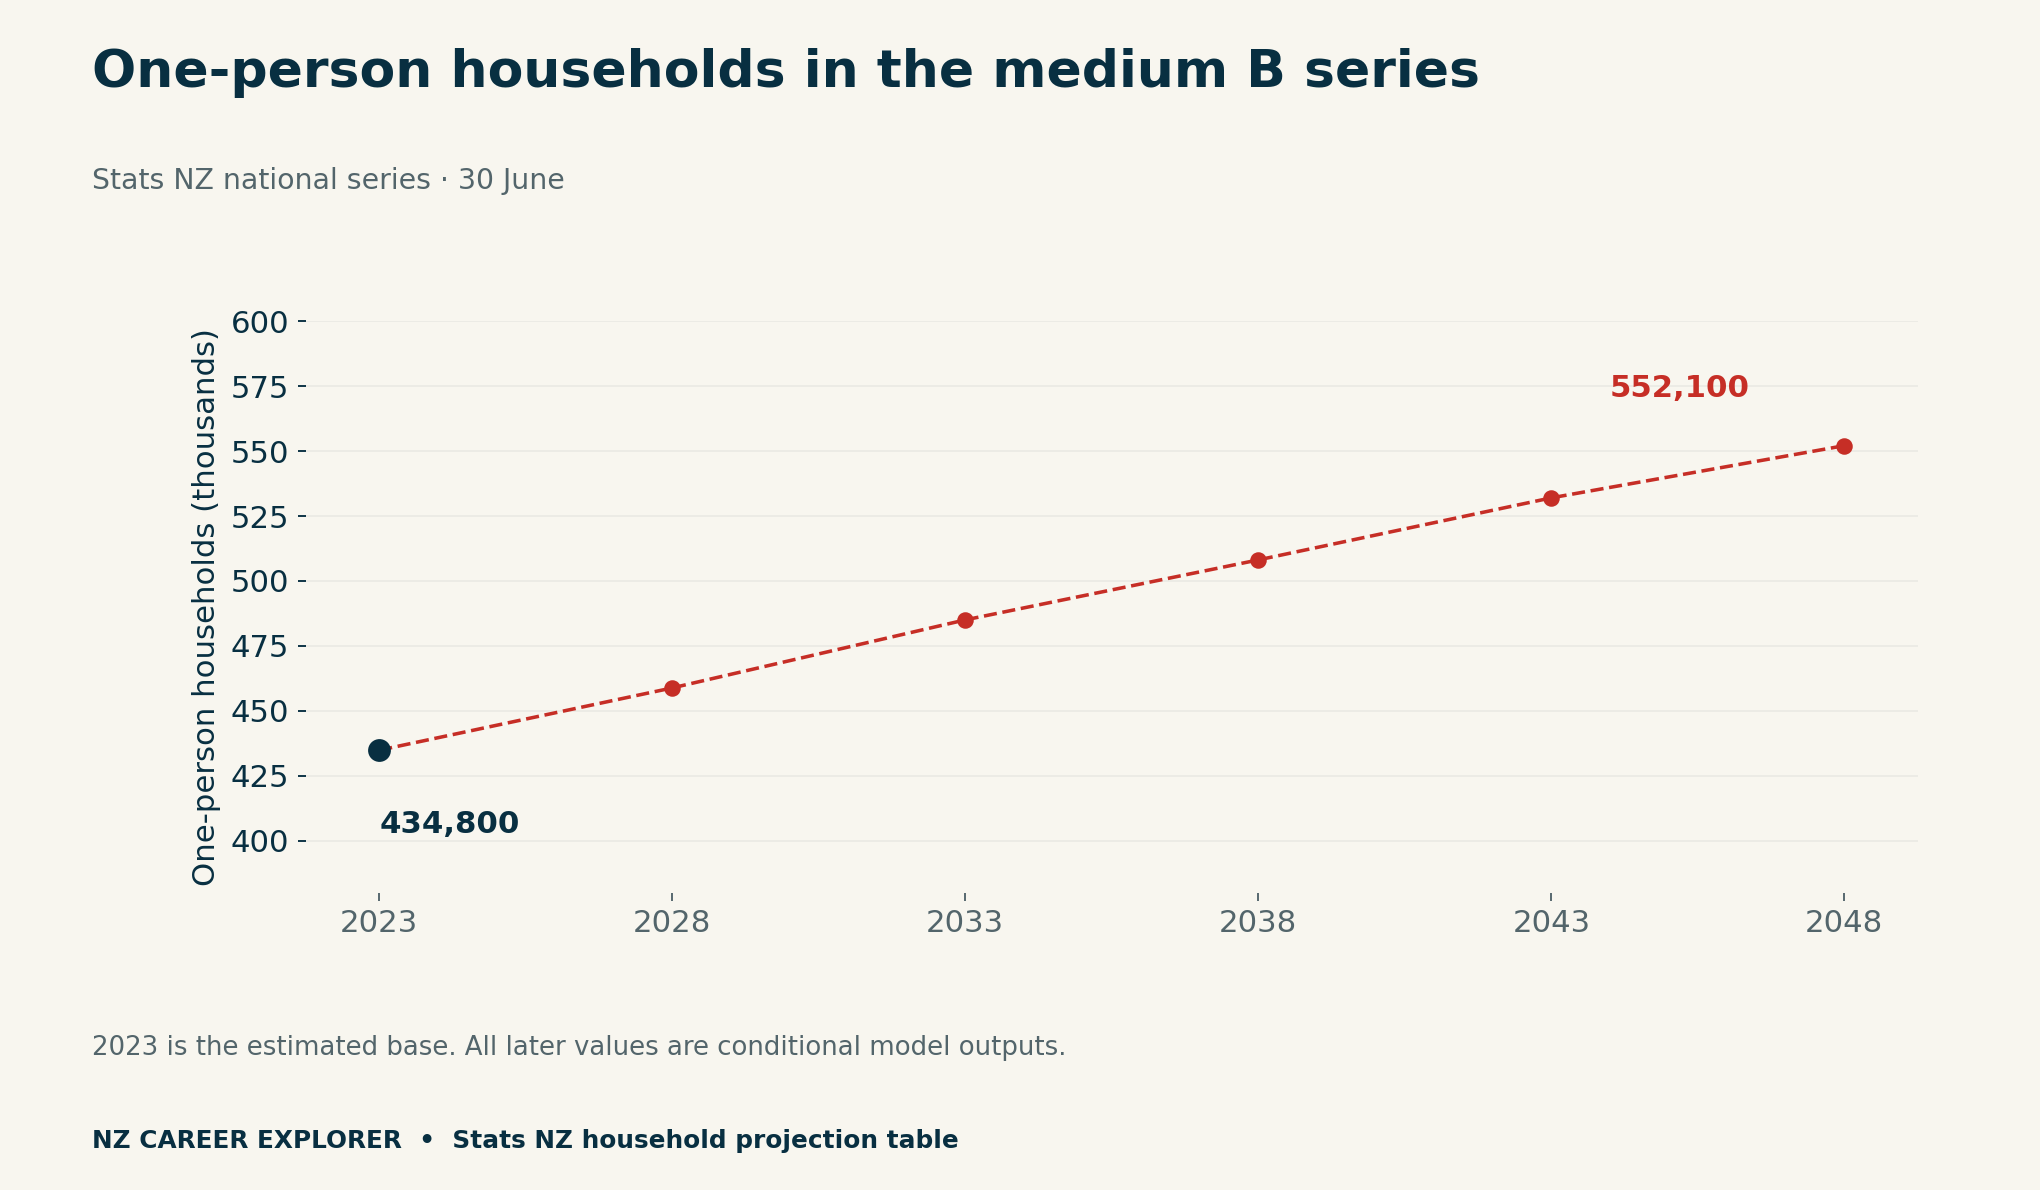
The detailed series provides six five-year points. However, the line describes the scenario across that horizon. It does not show observations between 2023 and 2048. Moreover, a one-person household is a count of living arrangements. It does not tell you how many people need a particular support service.
Turn the numbers into a local evidence request
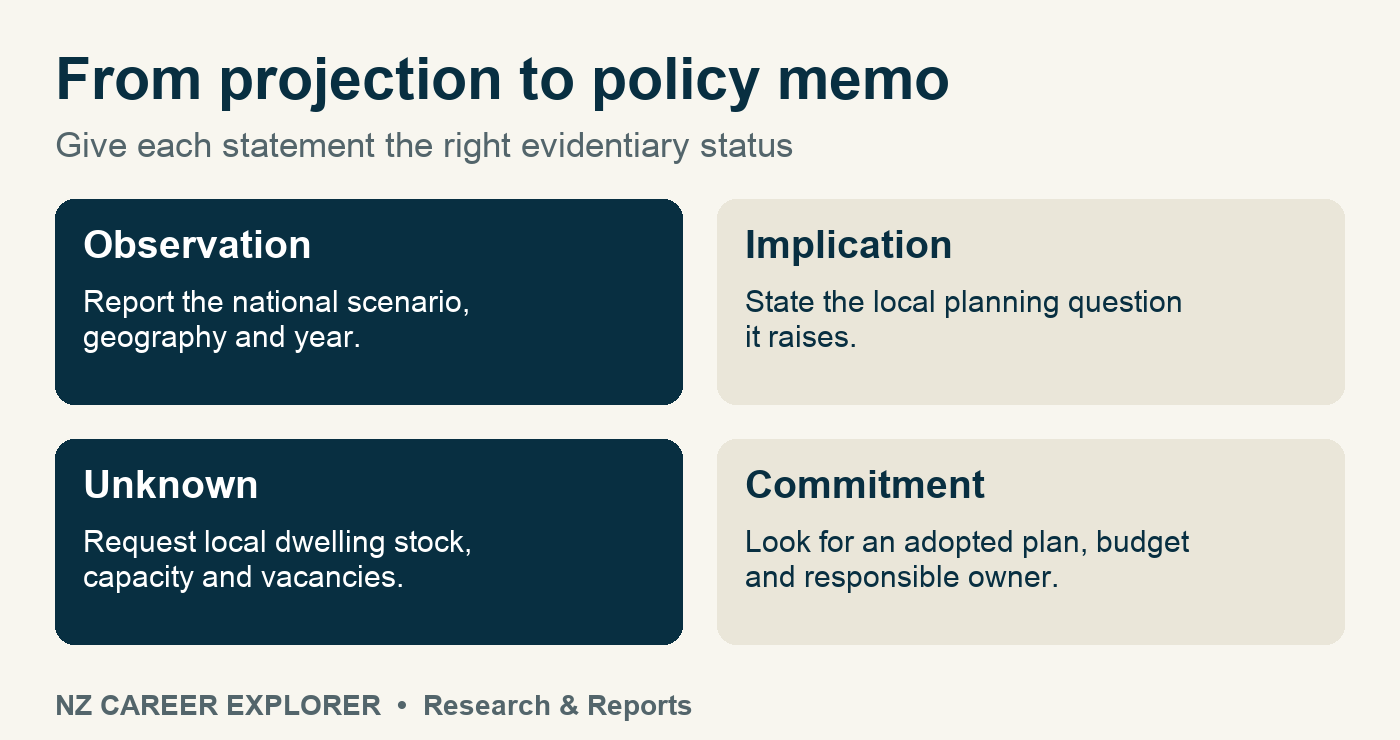
Suppose an interview panel asks how a change in household composition could affect a library network. The national data give a reason to check how people use local services. You might request the local scenario, branch catchment boundaries and evidence of current use. Include opening hours, access barriers and existing capacity. These questions leave room for outcomes that a national count cannot resolve.
If the question is housing, request the number and types of dwellings, vacancy and occupancy rates, and the planning geography. Define when each figure was measured. A change in projected households alone cannot establish the number or mix of dwellings to build. Similarly, a staffing decision requires a service model and budget.
Write the work sample
An effective opening might read: “Under Stats NZ’s national medium B assumptions, New Zealand reaches 2.47 million households in 2048. For this council, the next step is to compare matched local scenarios, occupied dwelling stock and available capacity.” Then add the date, data owner and question for each proposed follow-up. Keep the next step proportionate to the evidence.
Finally, mark any reference to an adopted plan or funding decision with its own source and date. The approved document is the evidence of the commitment. Our NZ filled-jobs article offers another example of checking the measure before turning a national number into a local claim.
Methods and downloadable files
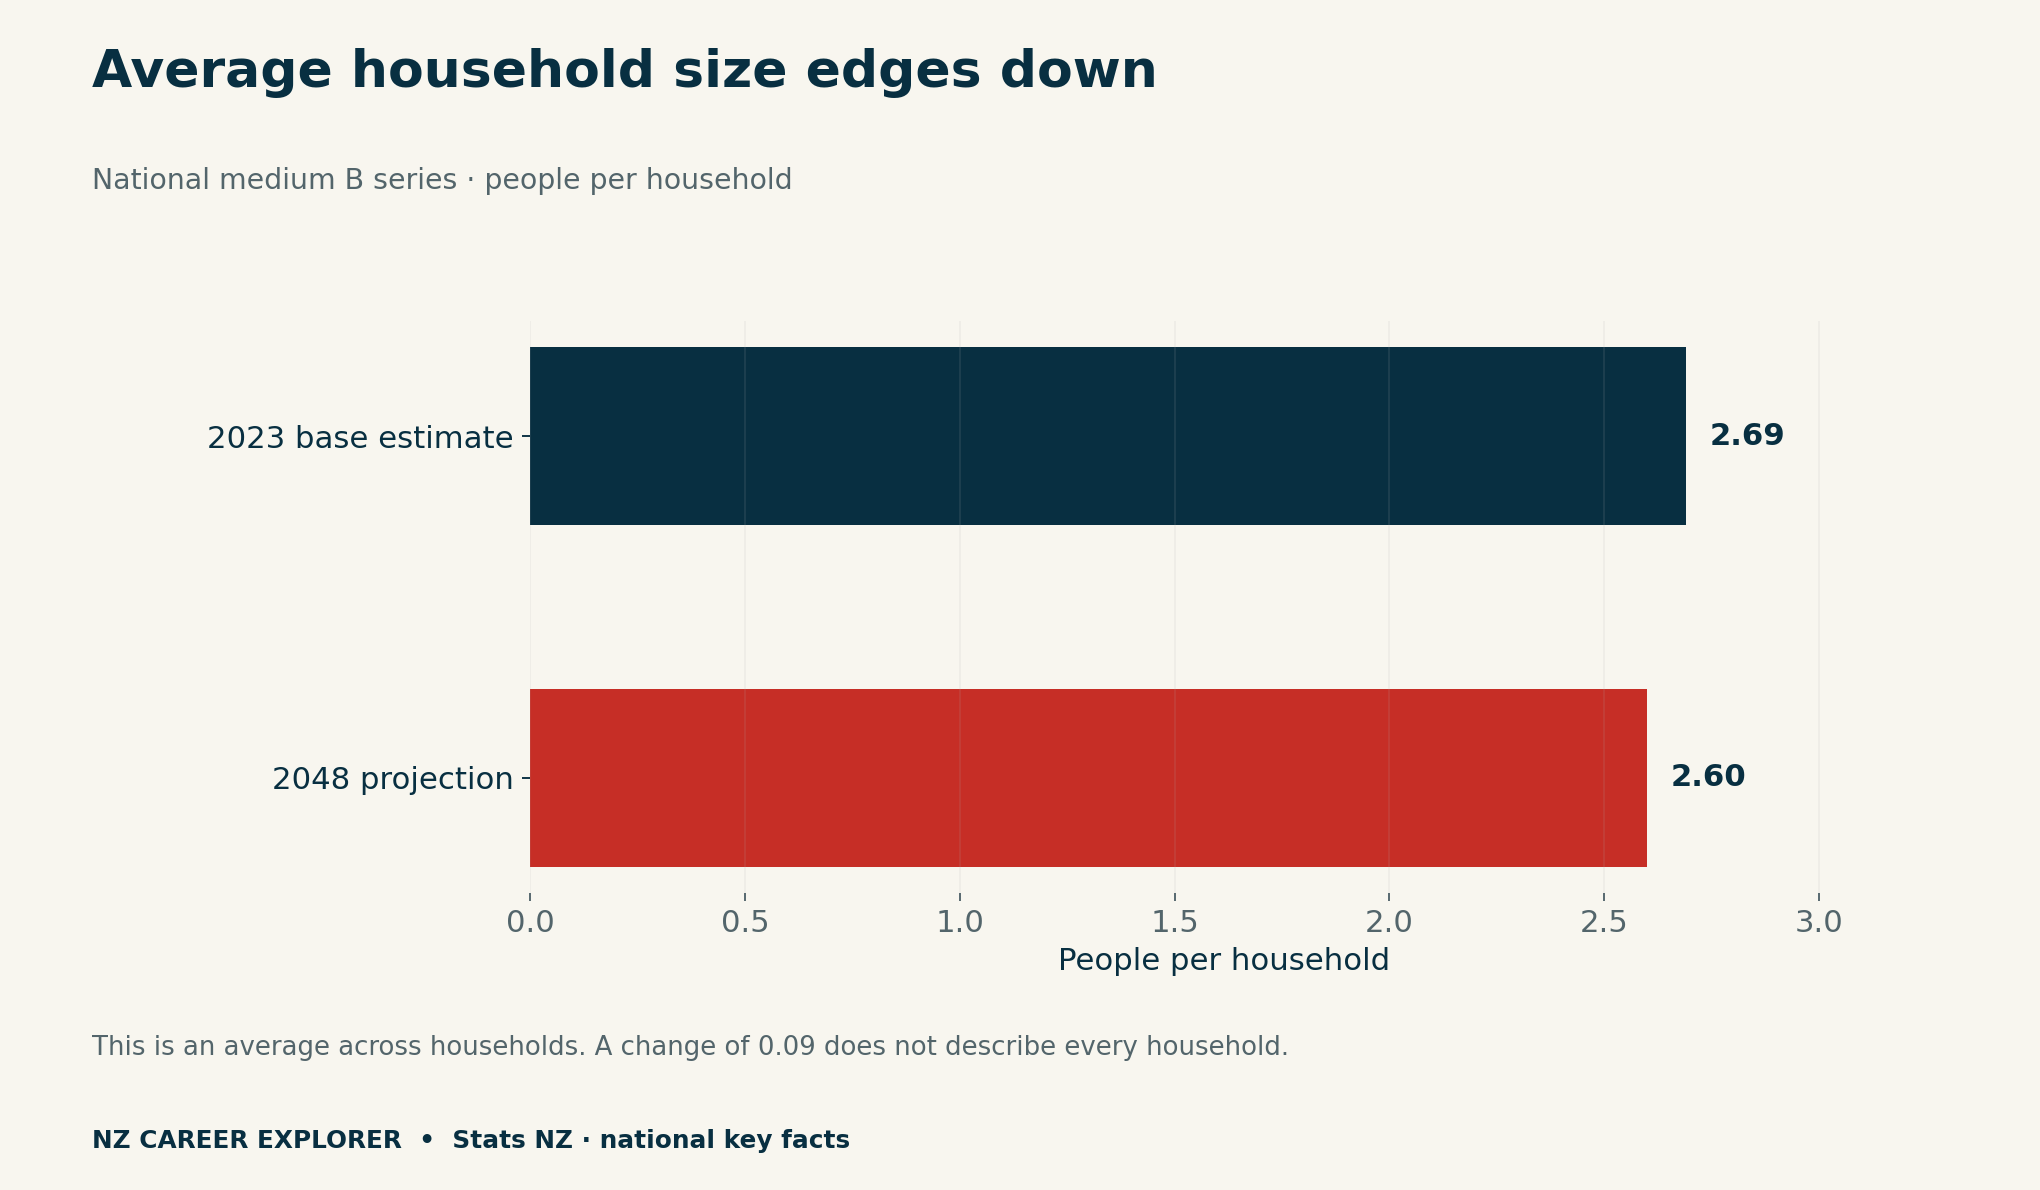
The series CSV records the national medium B household-type table at 30 June. The endpoint CSV uses the rounded all-household headline, the detailed one-person table and the two average-size figures. The evidence register and memo worksheet are original templates. No local scenario is modelled here.


